Category hub
VWAP Indicators
A focused VWAP hub for futures traders comparing session VWAP, anchored VWAP, exponential VWAP, and the NinjaTrader downloads that support each workflow.
Open hubIndicator library
Browse real trading tools by platform, workflow, and skill level. Each product page includes practical notes, live chart captures, downloads when available, and source examples where they exist.
Featured workflows
Category hub
A focused VWAP hub for futures traders comparing session VWAP, anchored VWAP, exponential VWAP, and the NinjaTrader downloads that support each workflow.
Open hubCategory hub
Indicator pages and source examples for traders who want to read participation and urgency without cluttering the chart.
Open hubCategory hub
A hub for opening range, inside bar, breakout, and channel tools that help organize price action without pretending to trade for you.
Open hubCategory hub
A level-building hub for futures traders comparing prior-day levels, weekly and monthly references, pivots, gaps, and clean support/resistance stacks.
Open hubCategory hub
A hub for swing labels, trend-state tools, ribbons, and related pages that help traders read structure without overfitting the chart.
Open hub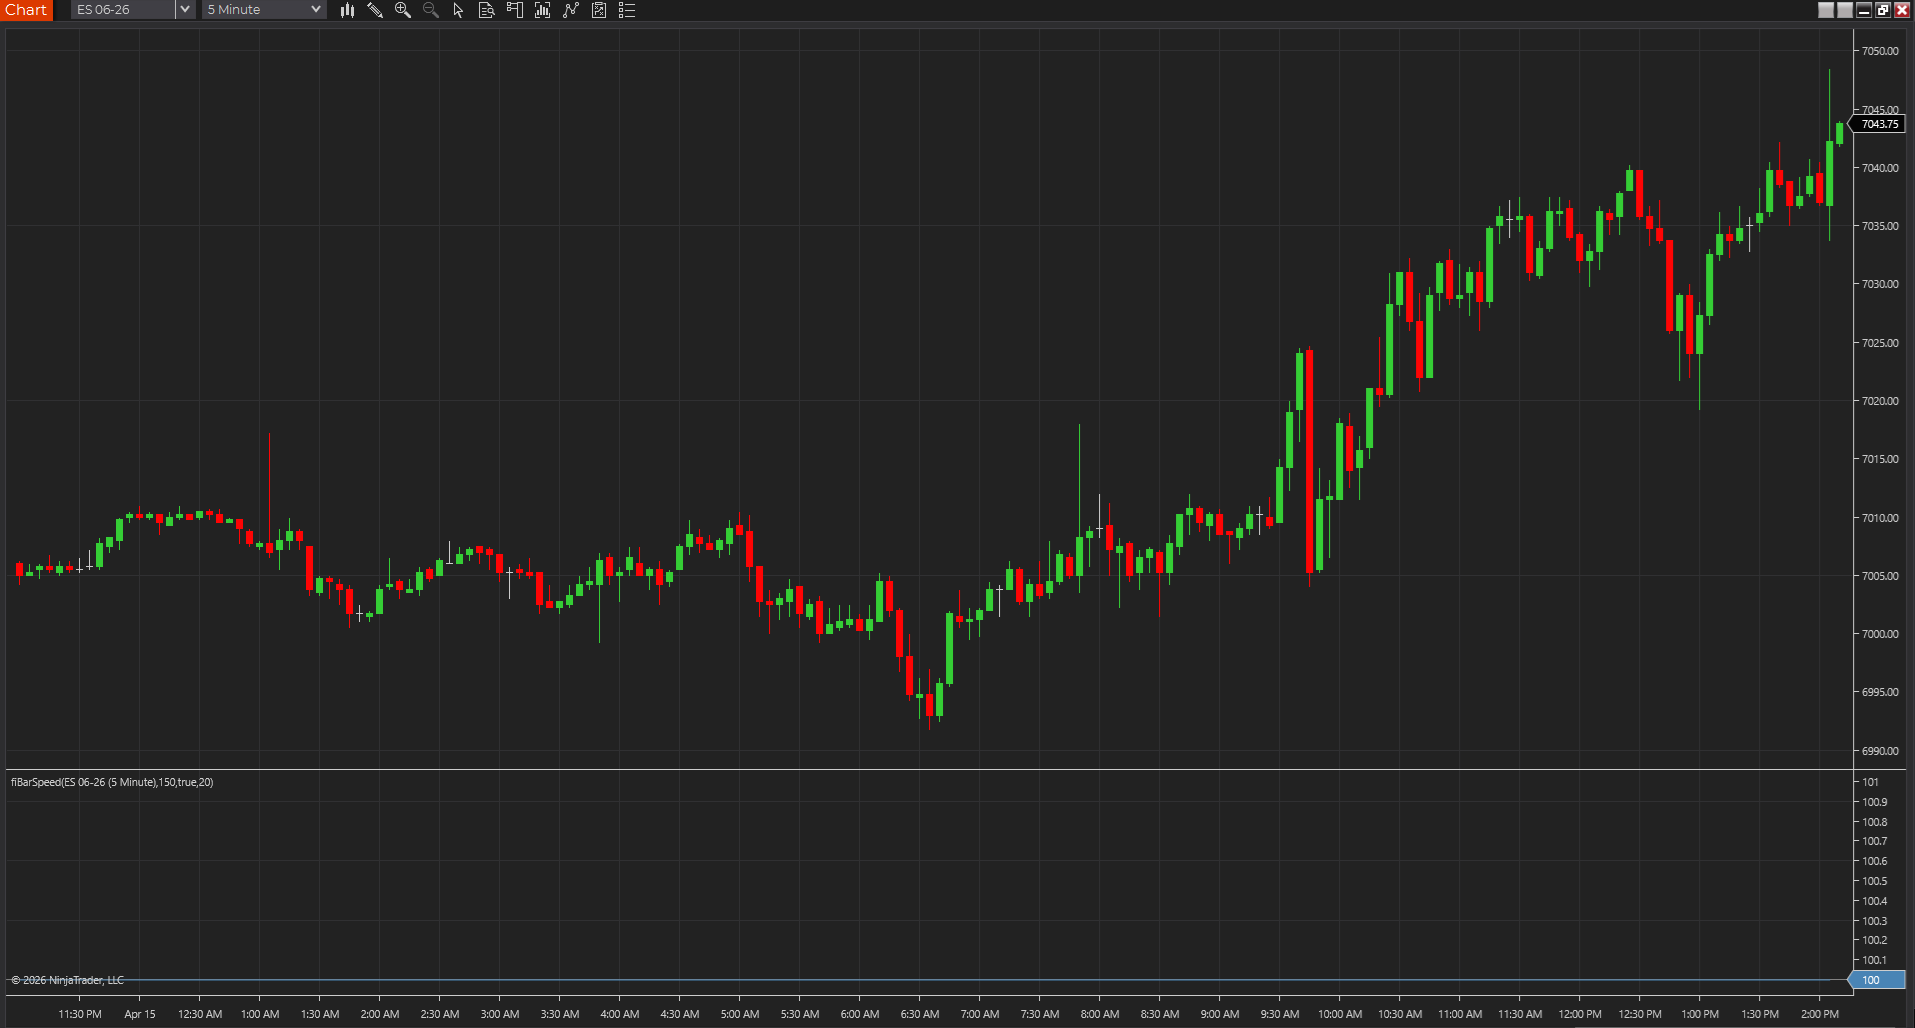
Shows whether bars are printing with real urgency or just drifting, so participation shifts stand out faster across tick, range, Renko, volume, and time charts.
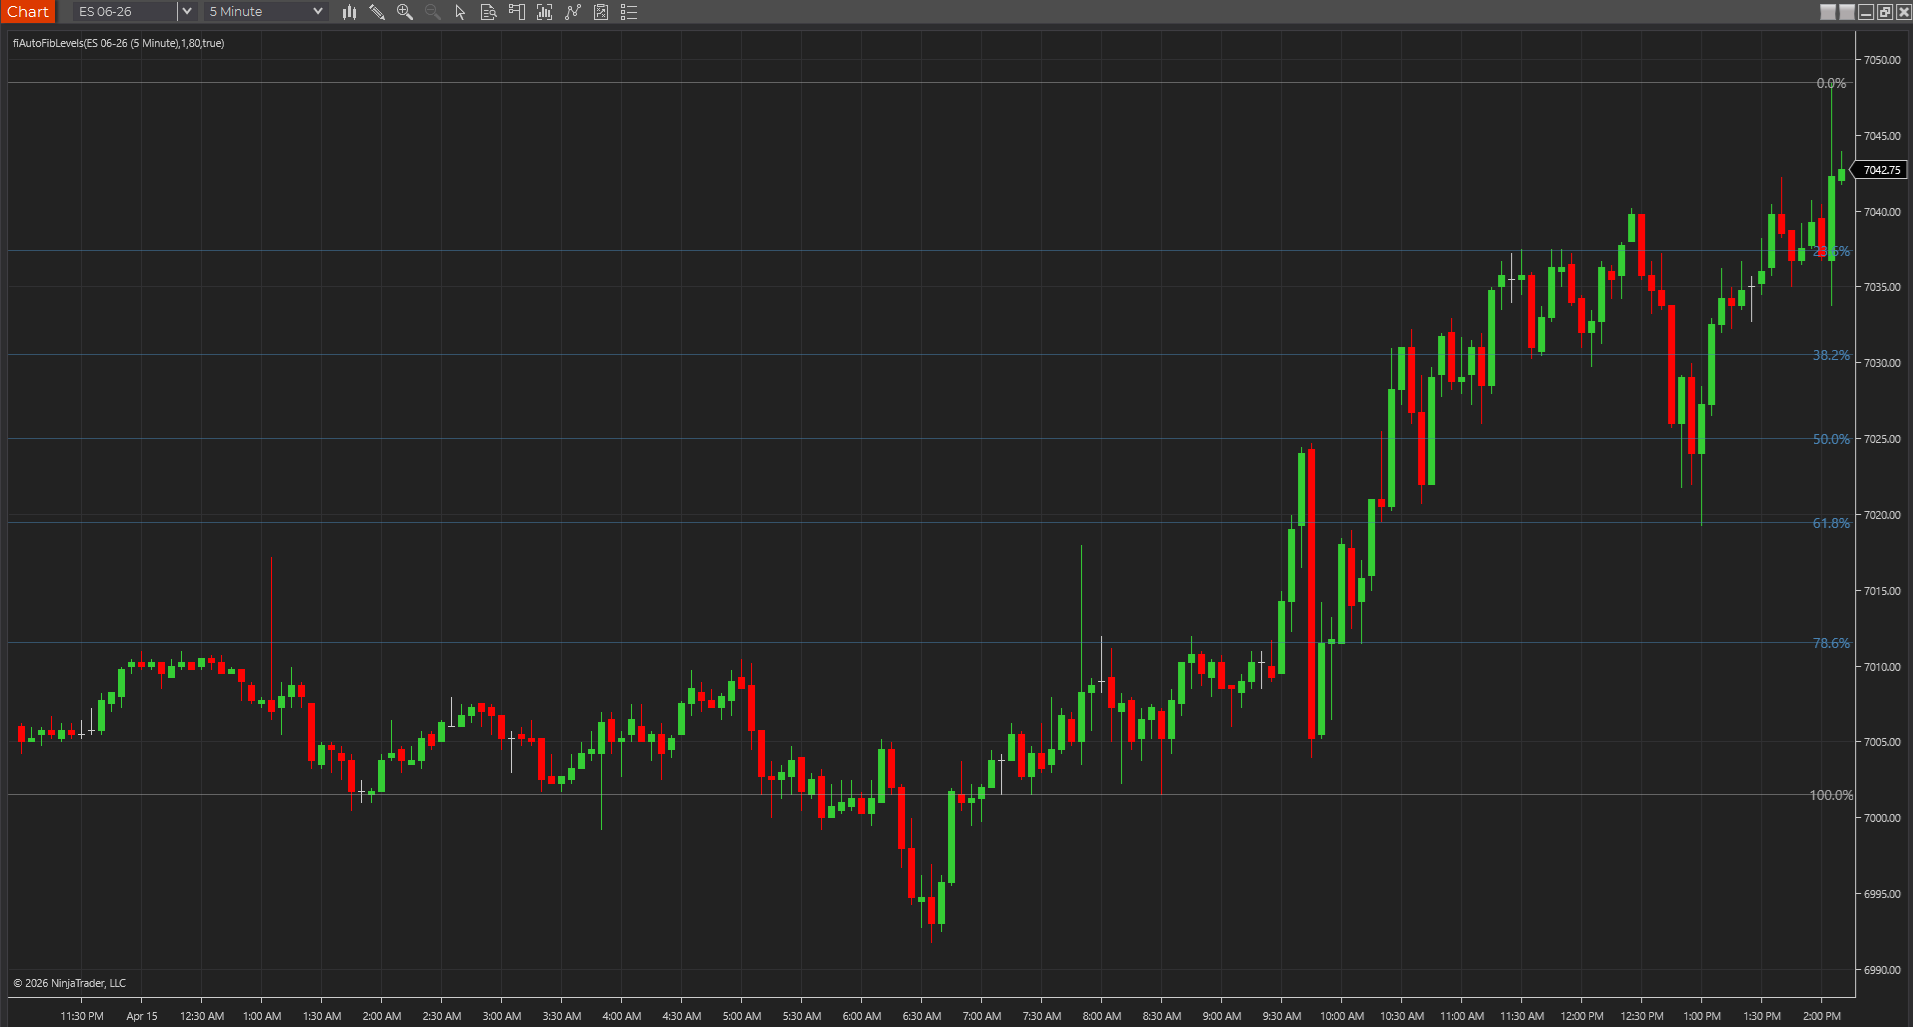
Keeps the recent swing's main Fibonacci retracement levels on screen, so pullback zones stay visible without manual drawing.
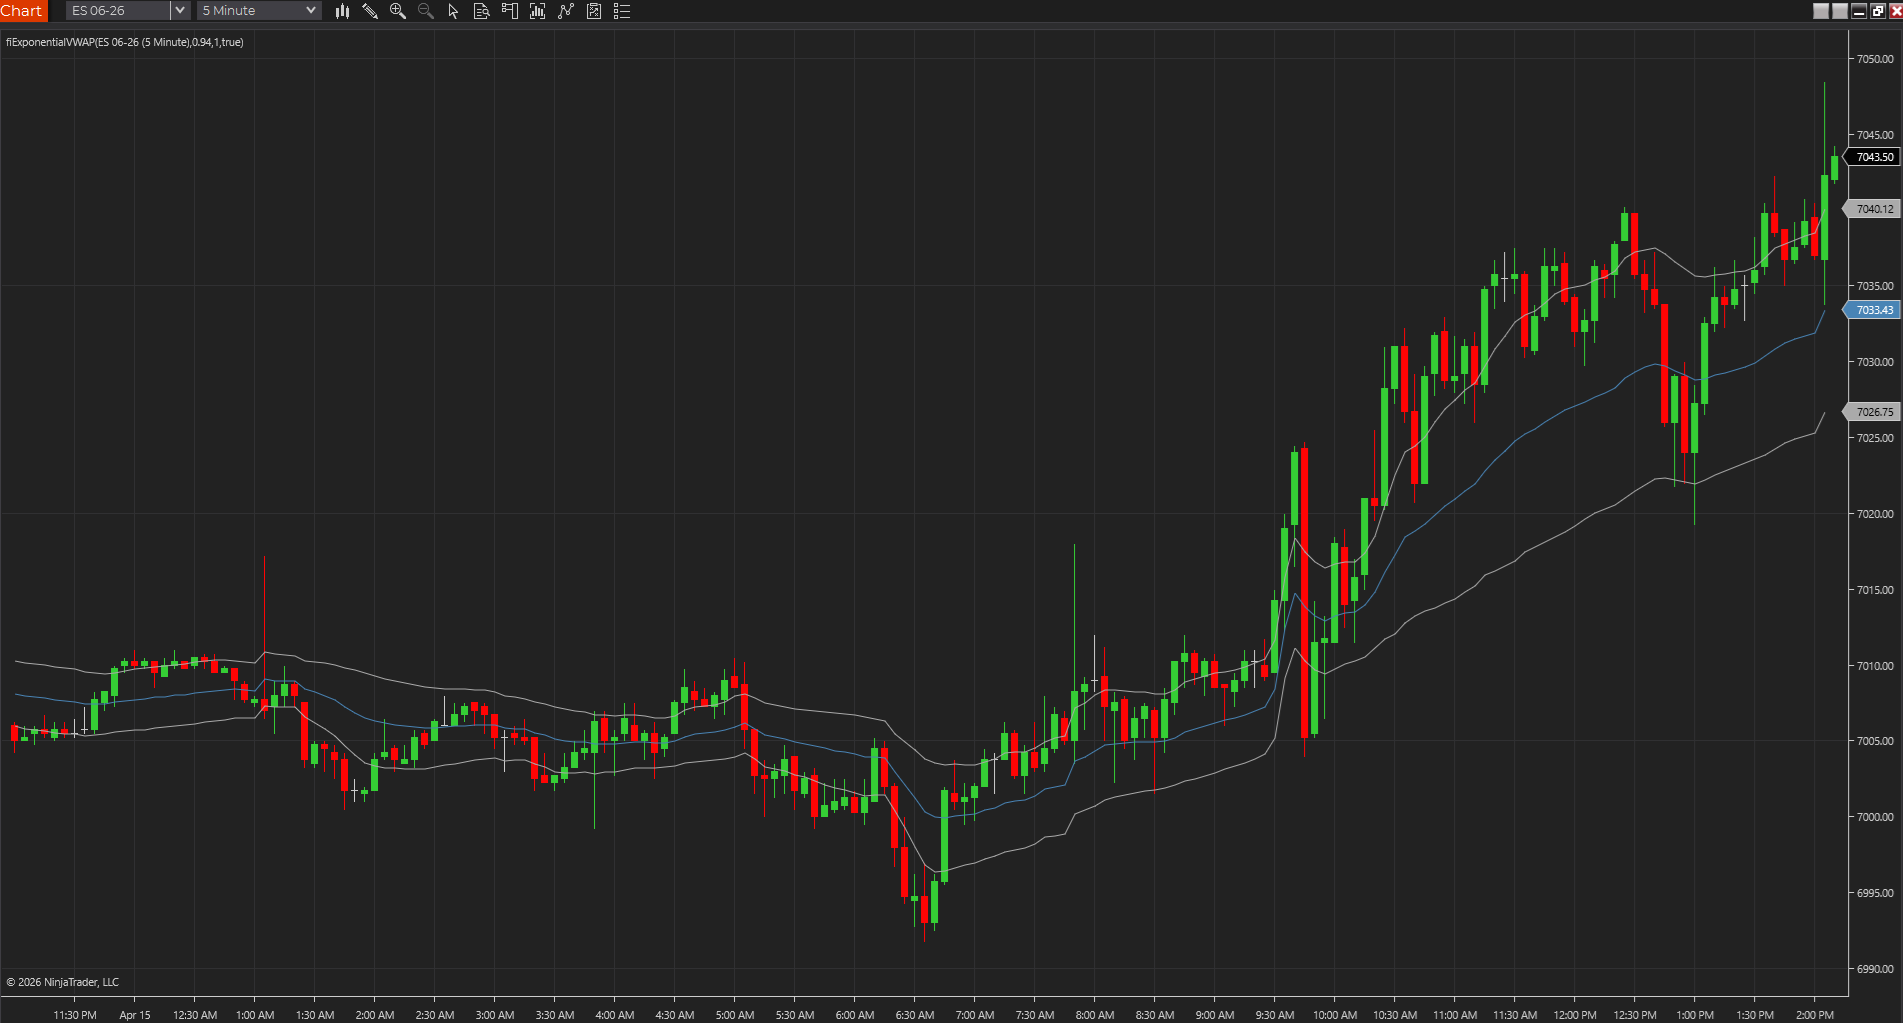
Uses exponential weighting to create a faster volume-weighted reference than standard session VWAP, which can help fair value react sooner during intraday shifts.
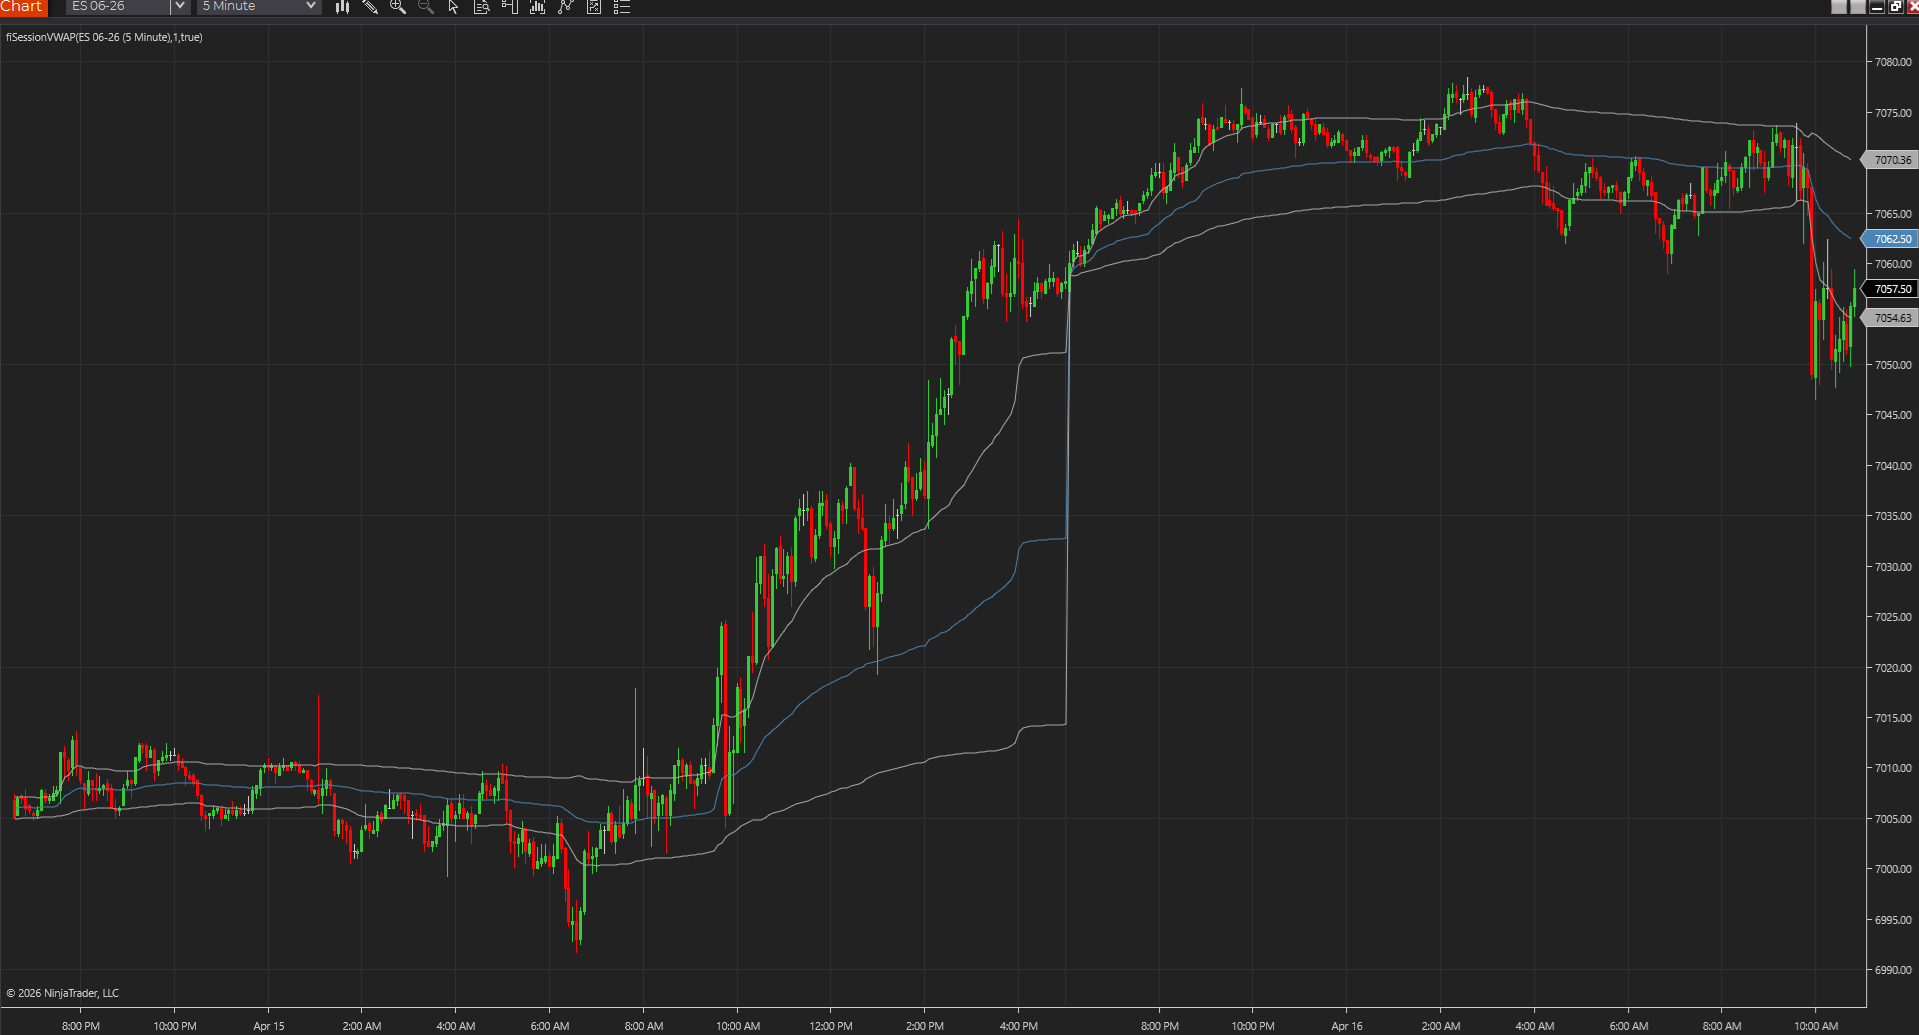
Plots a clean session-reset VWAP so traders can keep intraday fair value on screen without relying on a faster weighted variant.
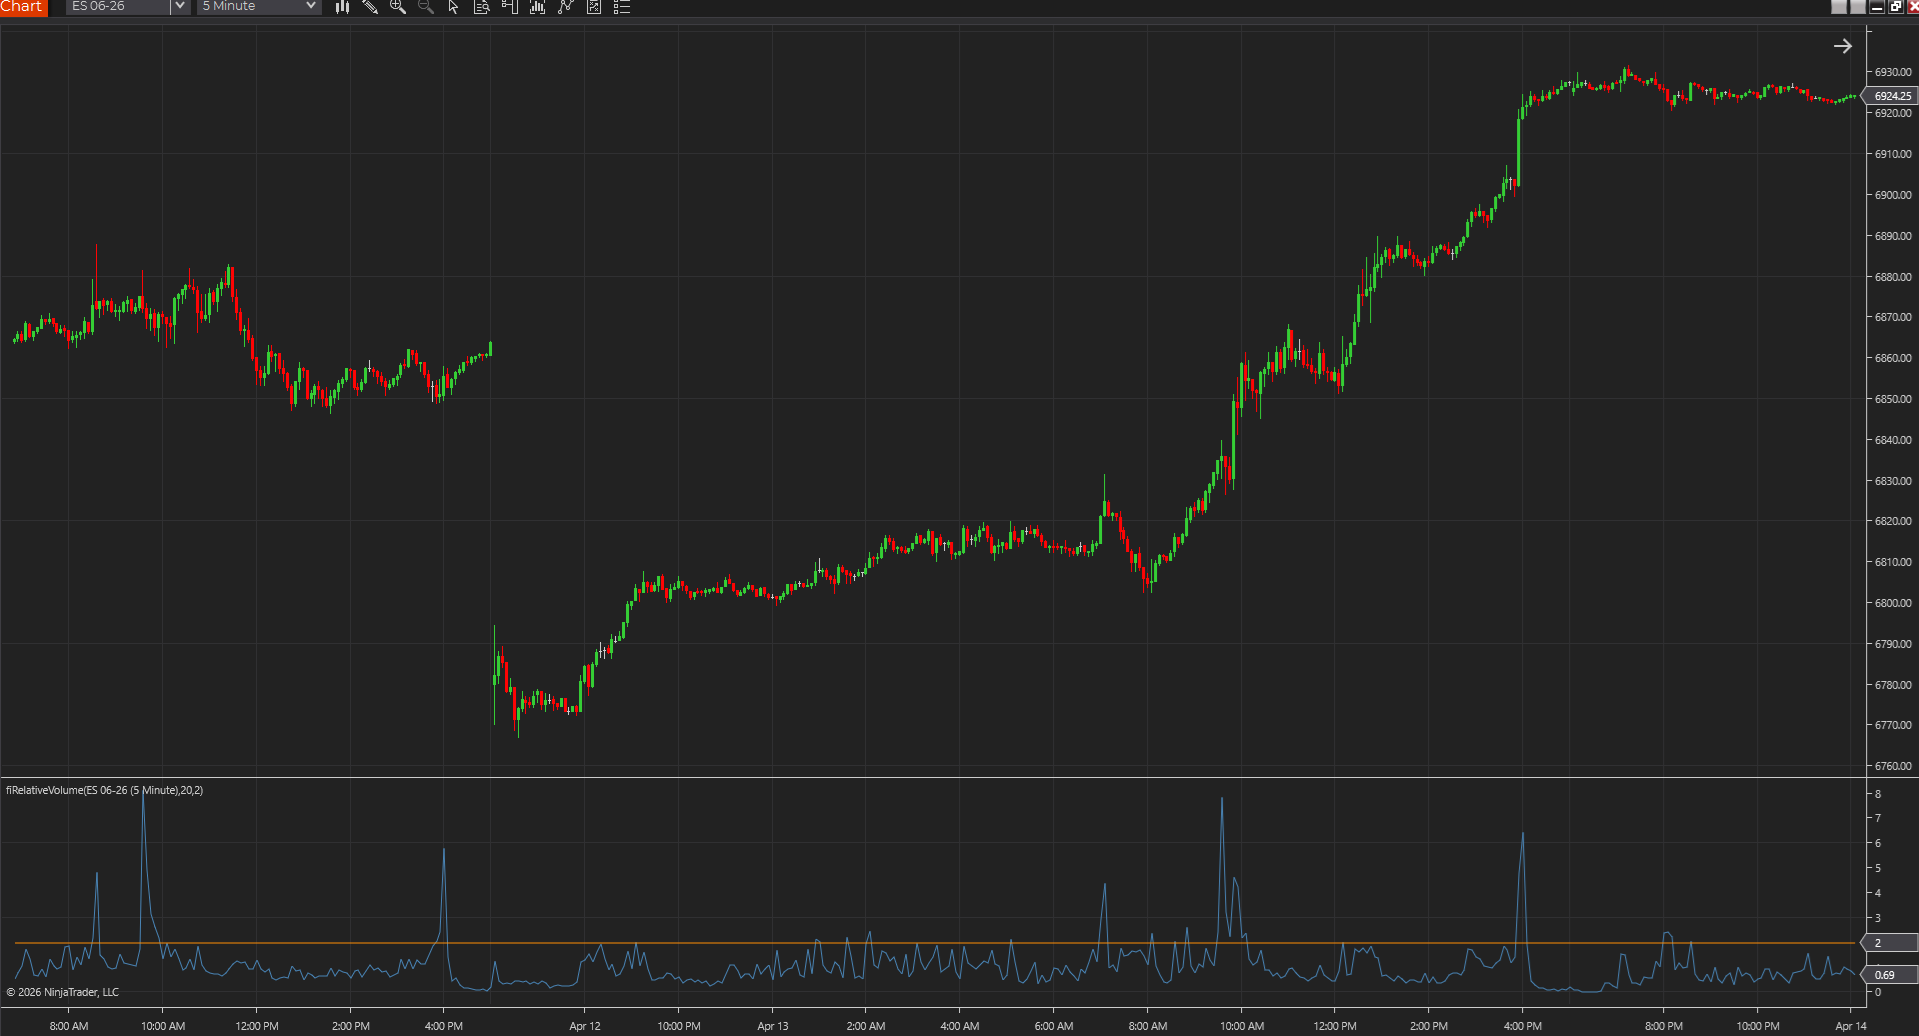
Measures current volume against its recent average so traders can see when participation is ordinary, elevated, or genuinely unusual.
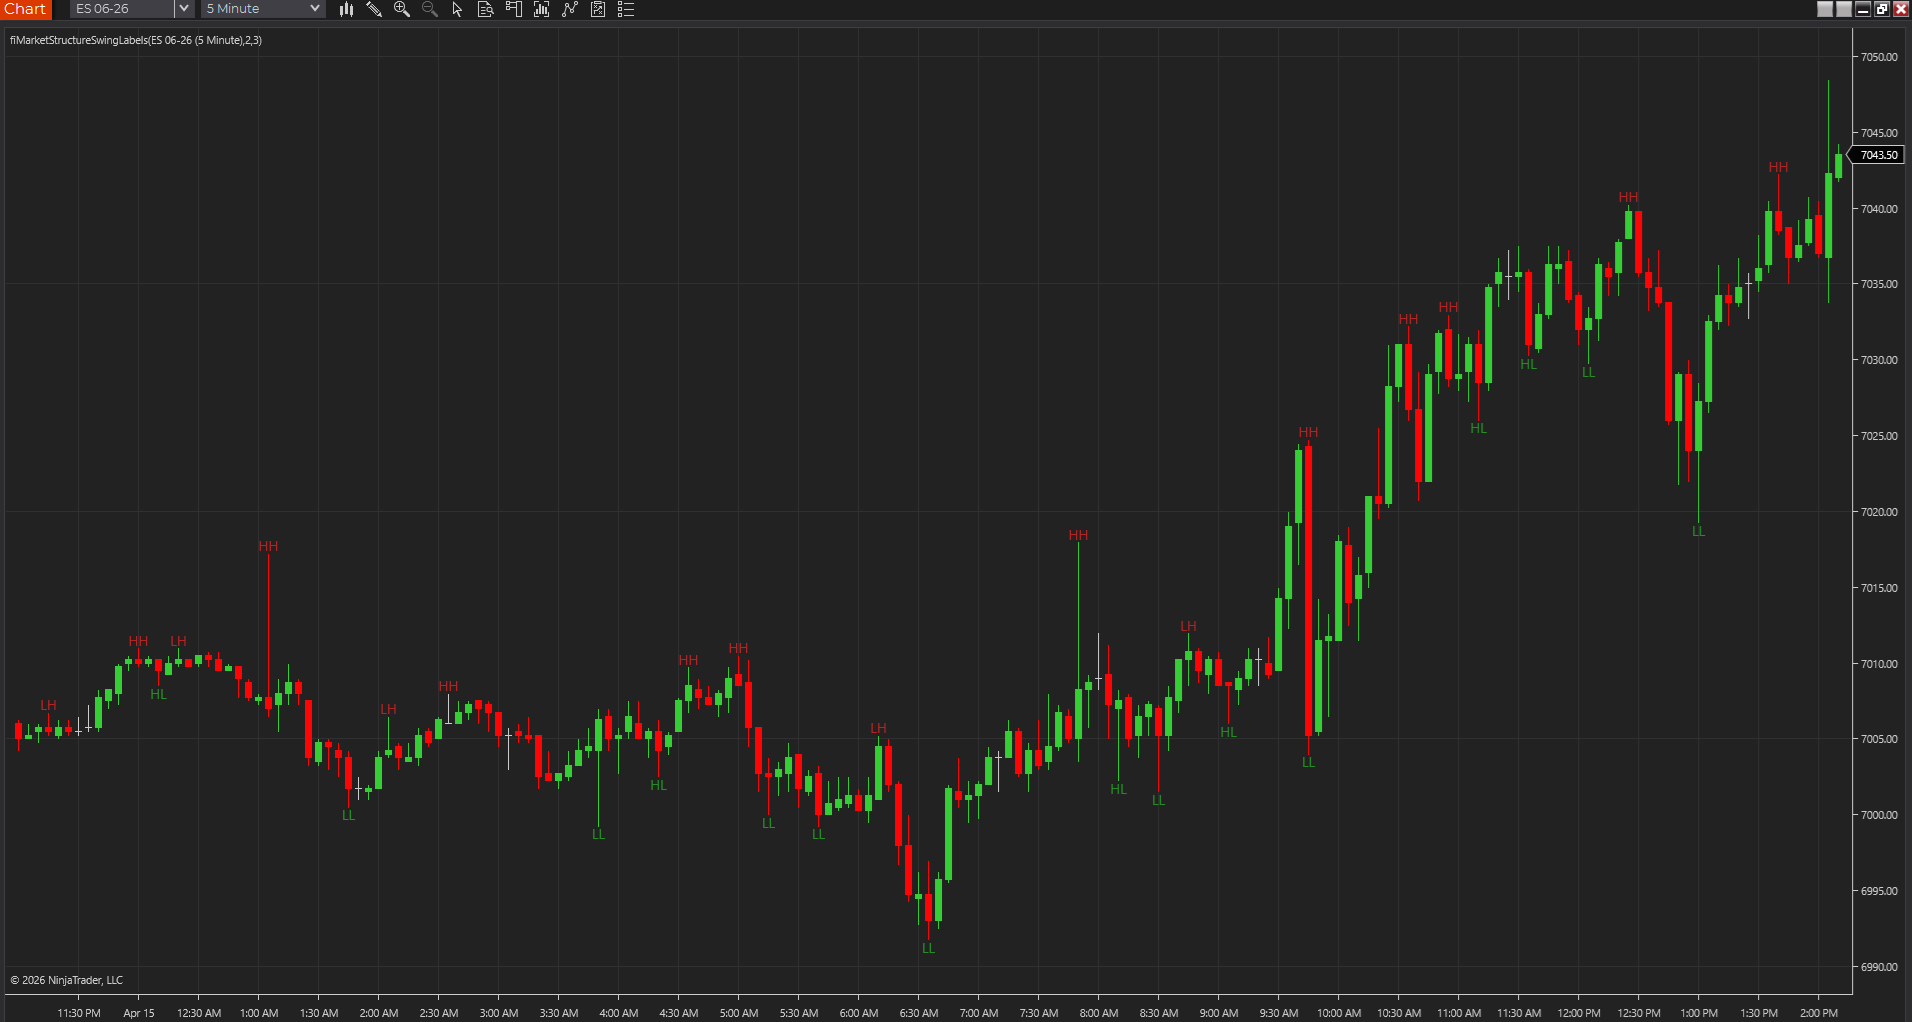
Labels higher highs, higher lows, lower highs, and lower lows so the current swing sequence is easier to read at a glance.
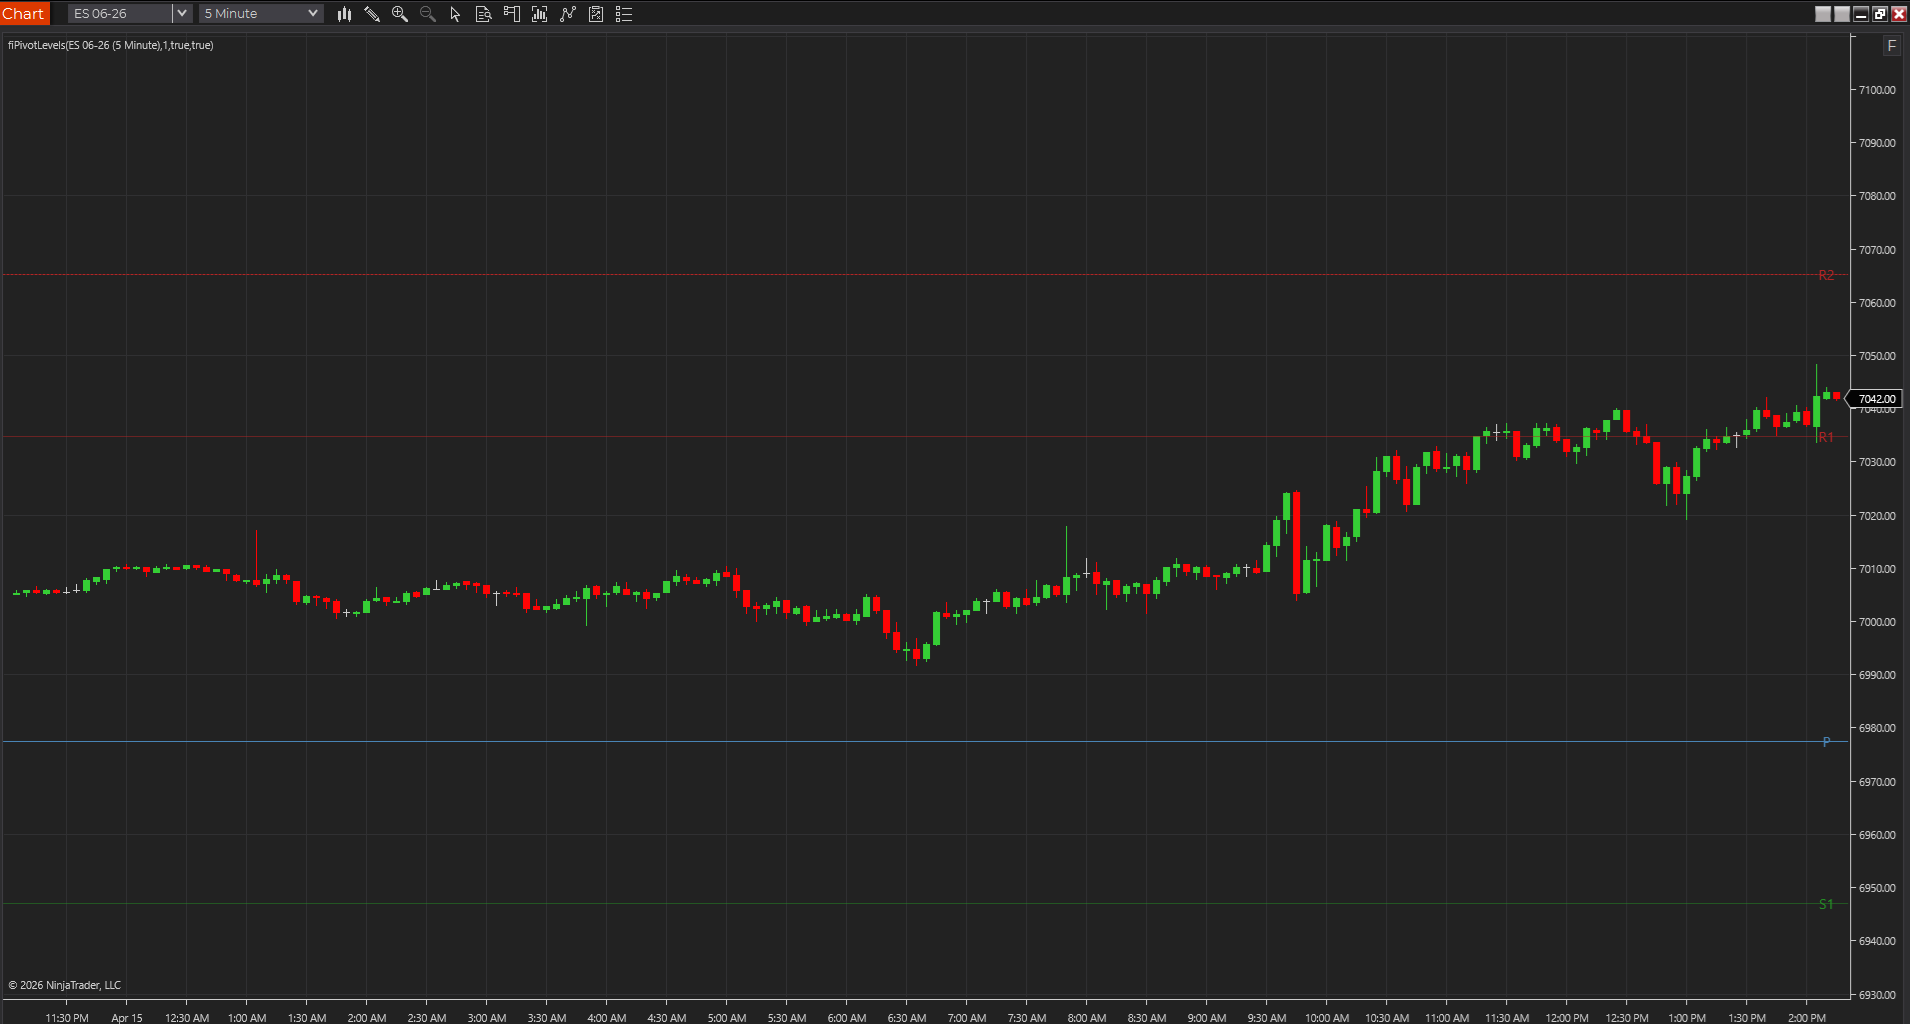
Draws classic pivot, support, and resistance levels from the prior session so traders have a ready-made intraday reference map.
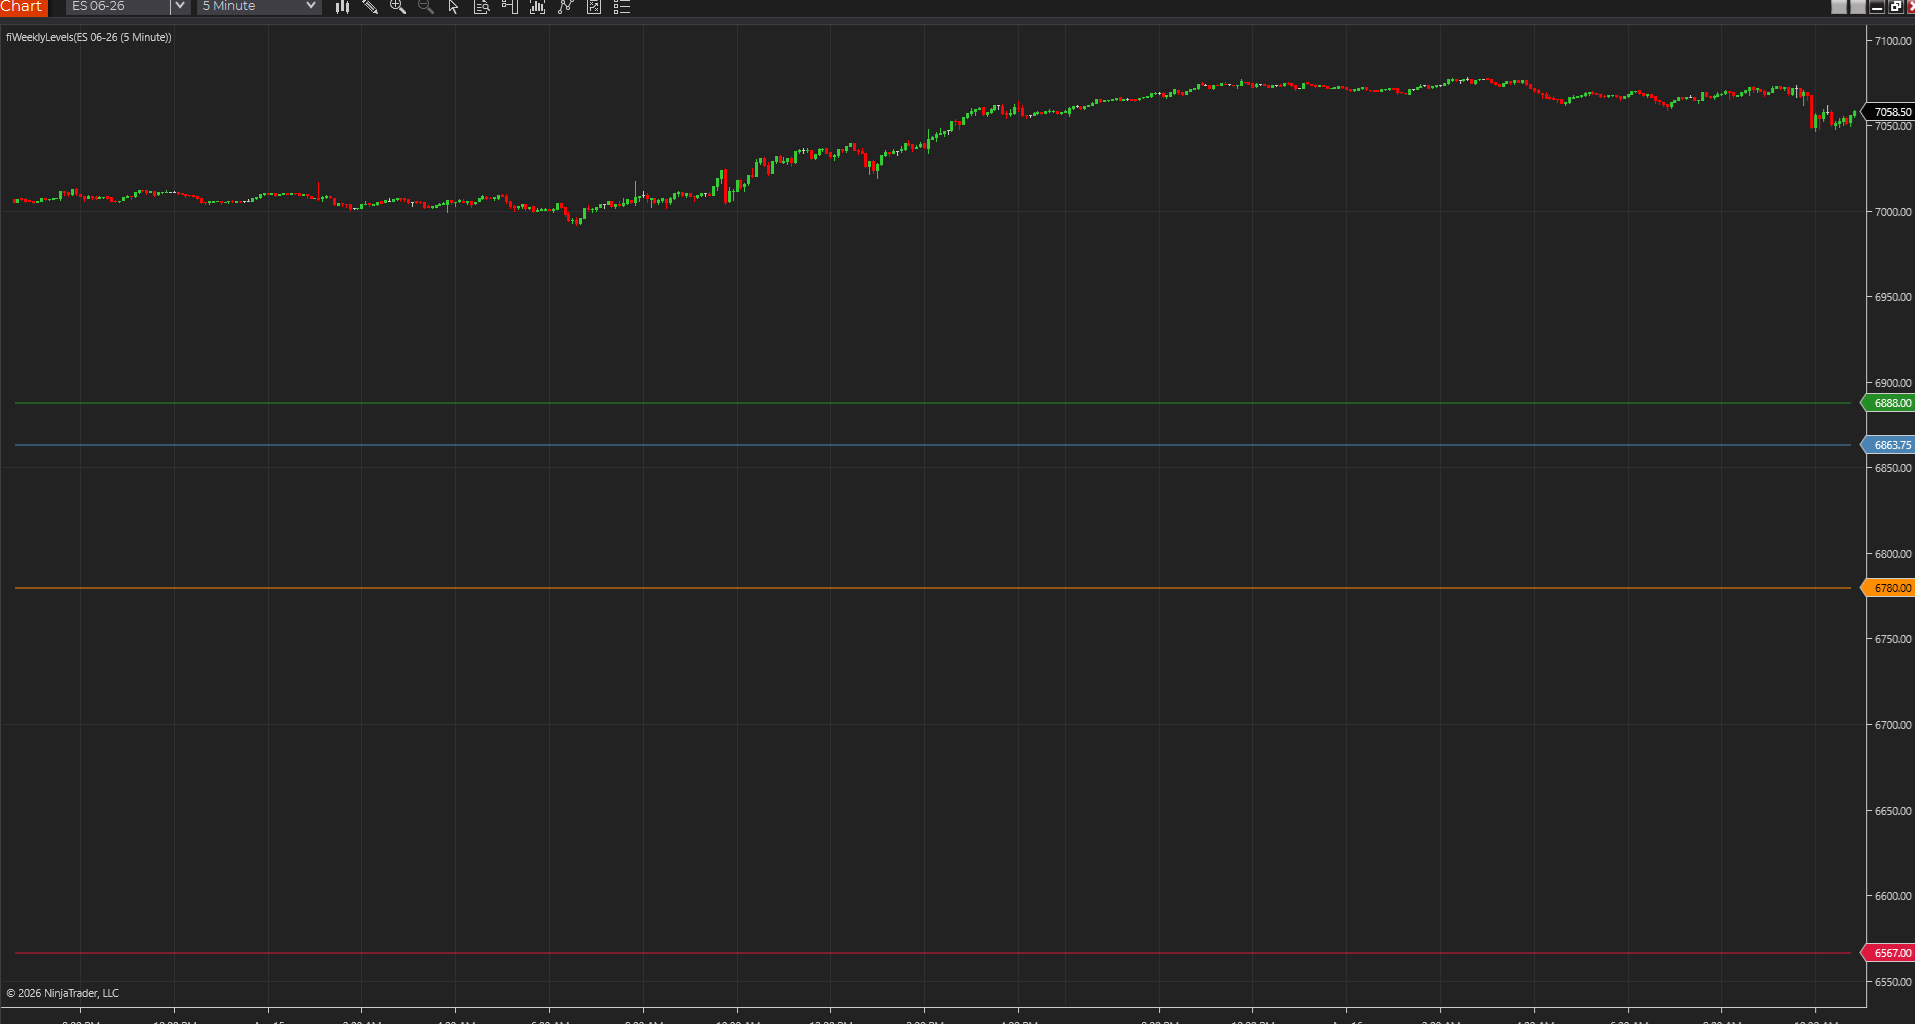
Keeps the prior week's high, low, close, and the current week's open on screen so broader reference prices stay visible on intraday charts.
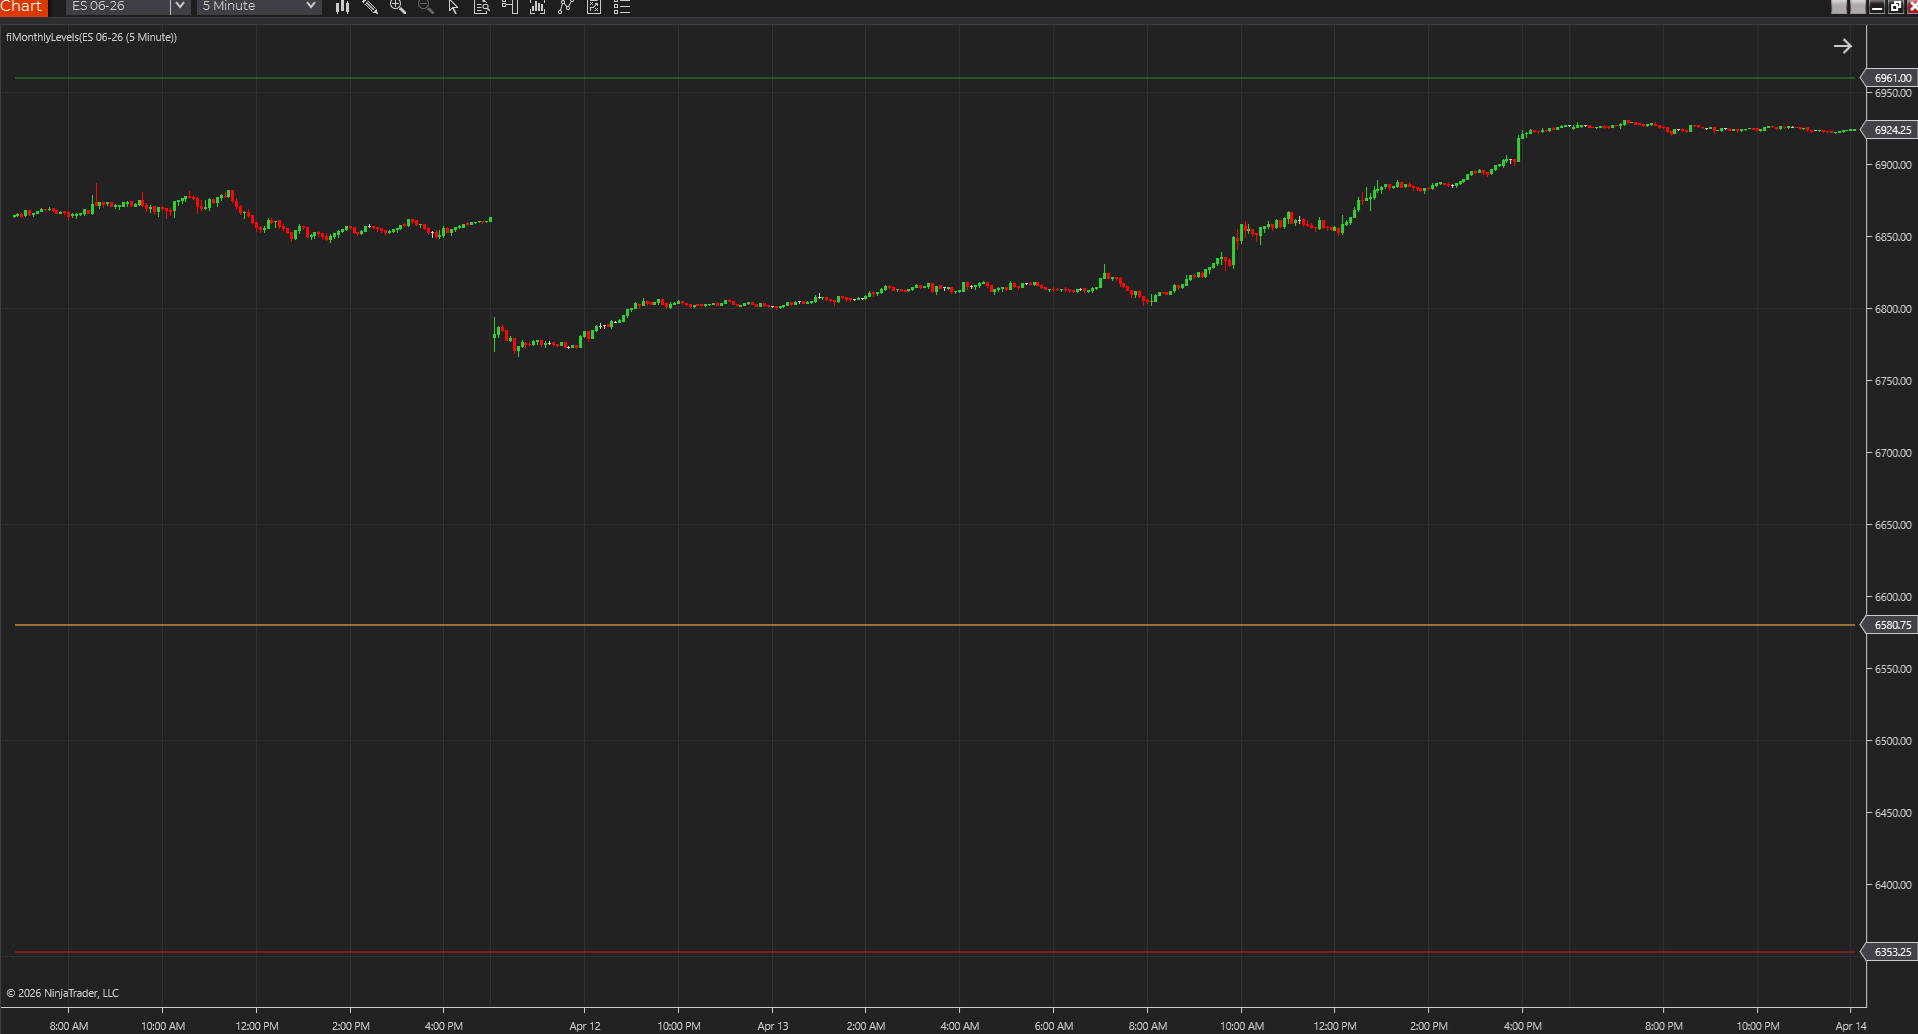
Shows the prior month's high, low, close, and the current month's open so bigger-picture reference prices stay visible every day.
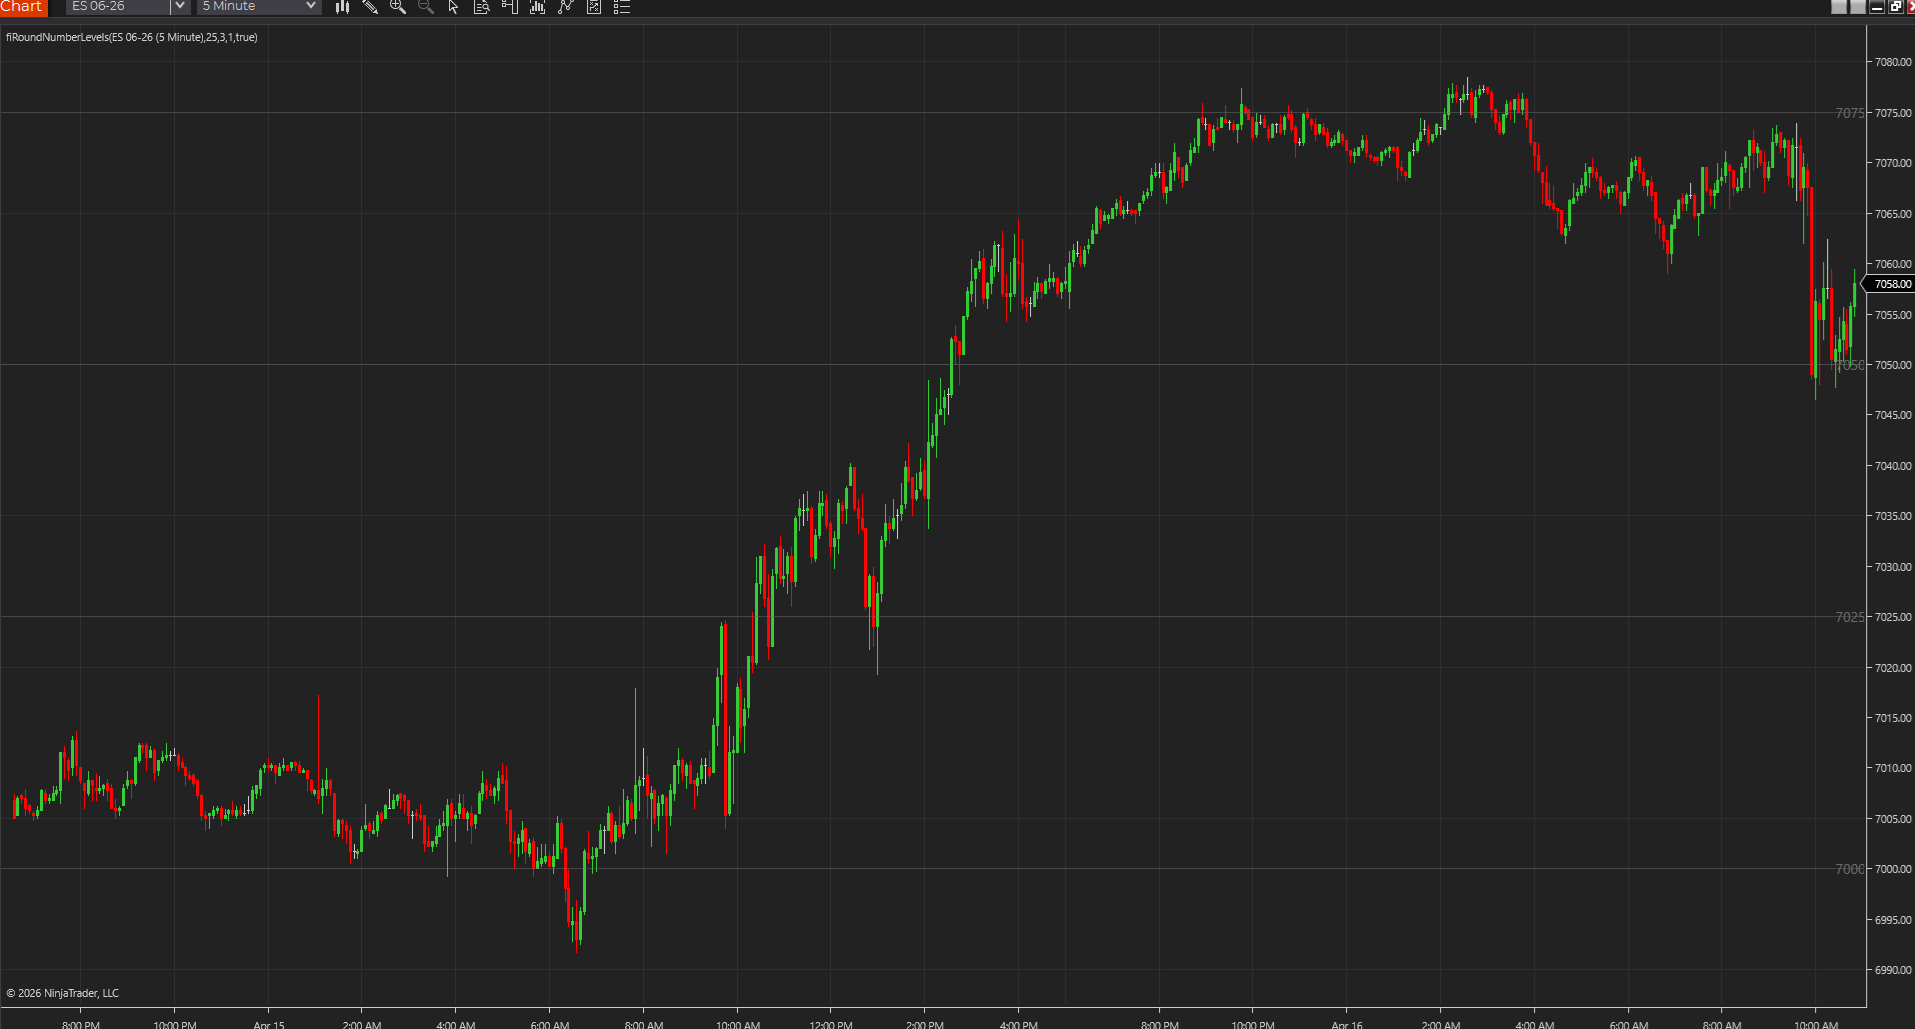
Draws round-number price references above and below the market so obvious psychological levels stay visible during fast intraday decisions.
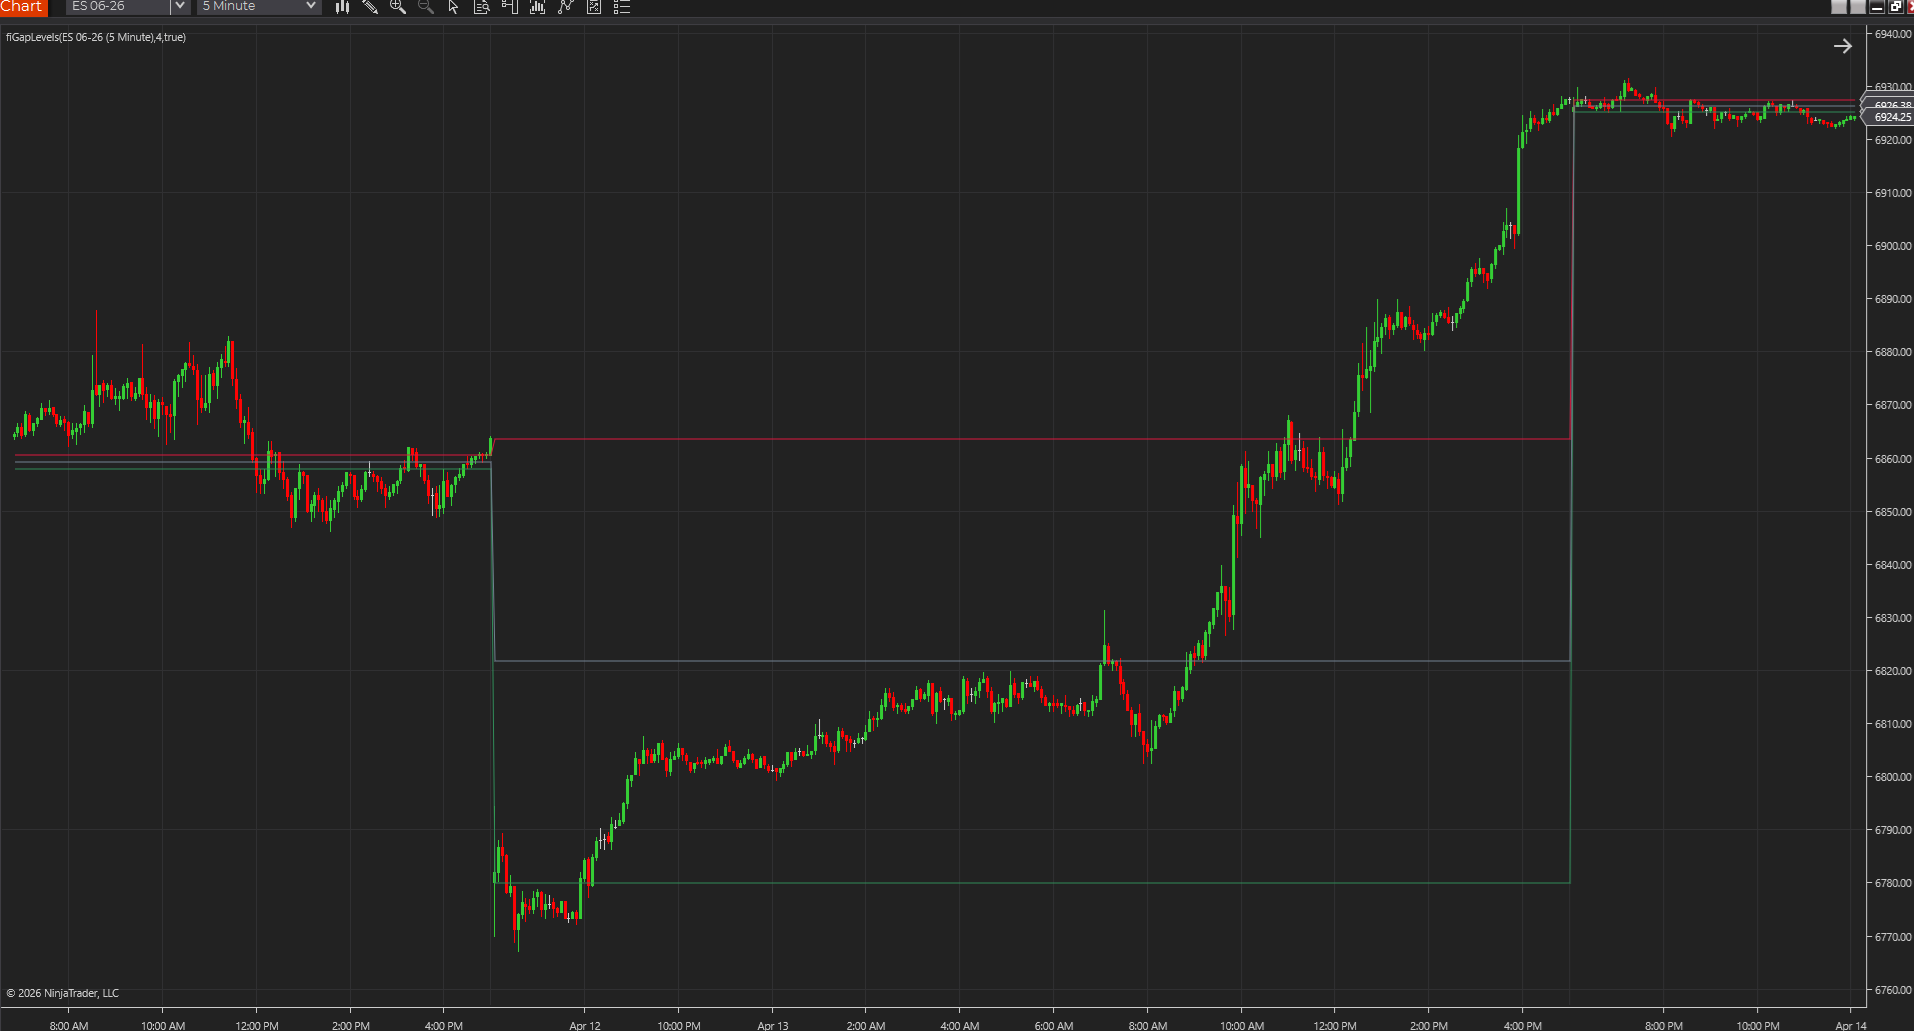
Marks opening gap boundaries and midpoint so traders can see the current session's gap structure without drawing it by hand.
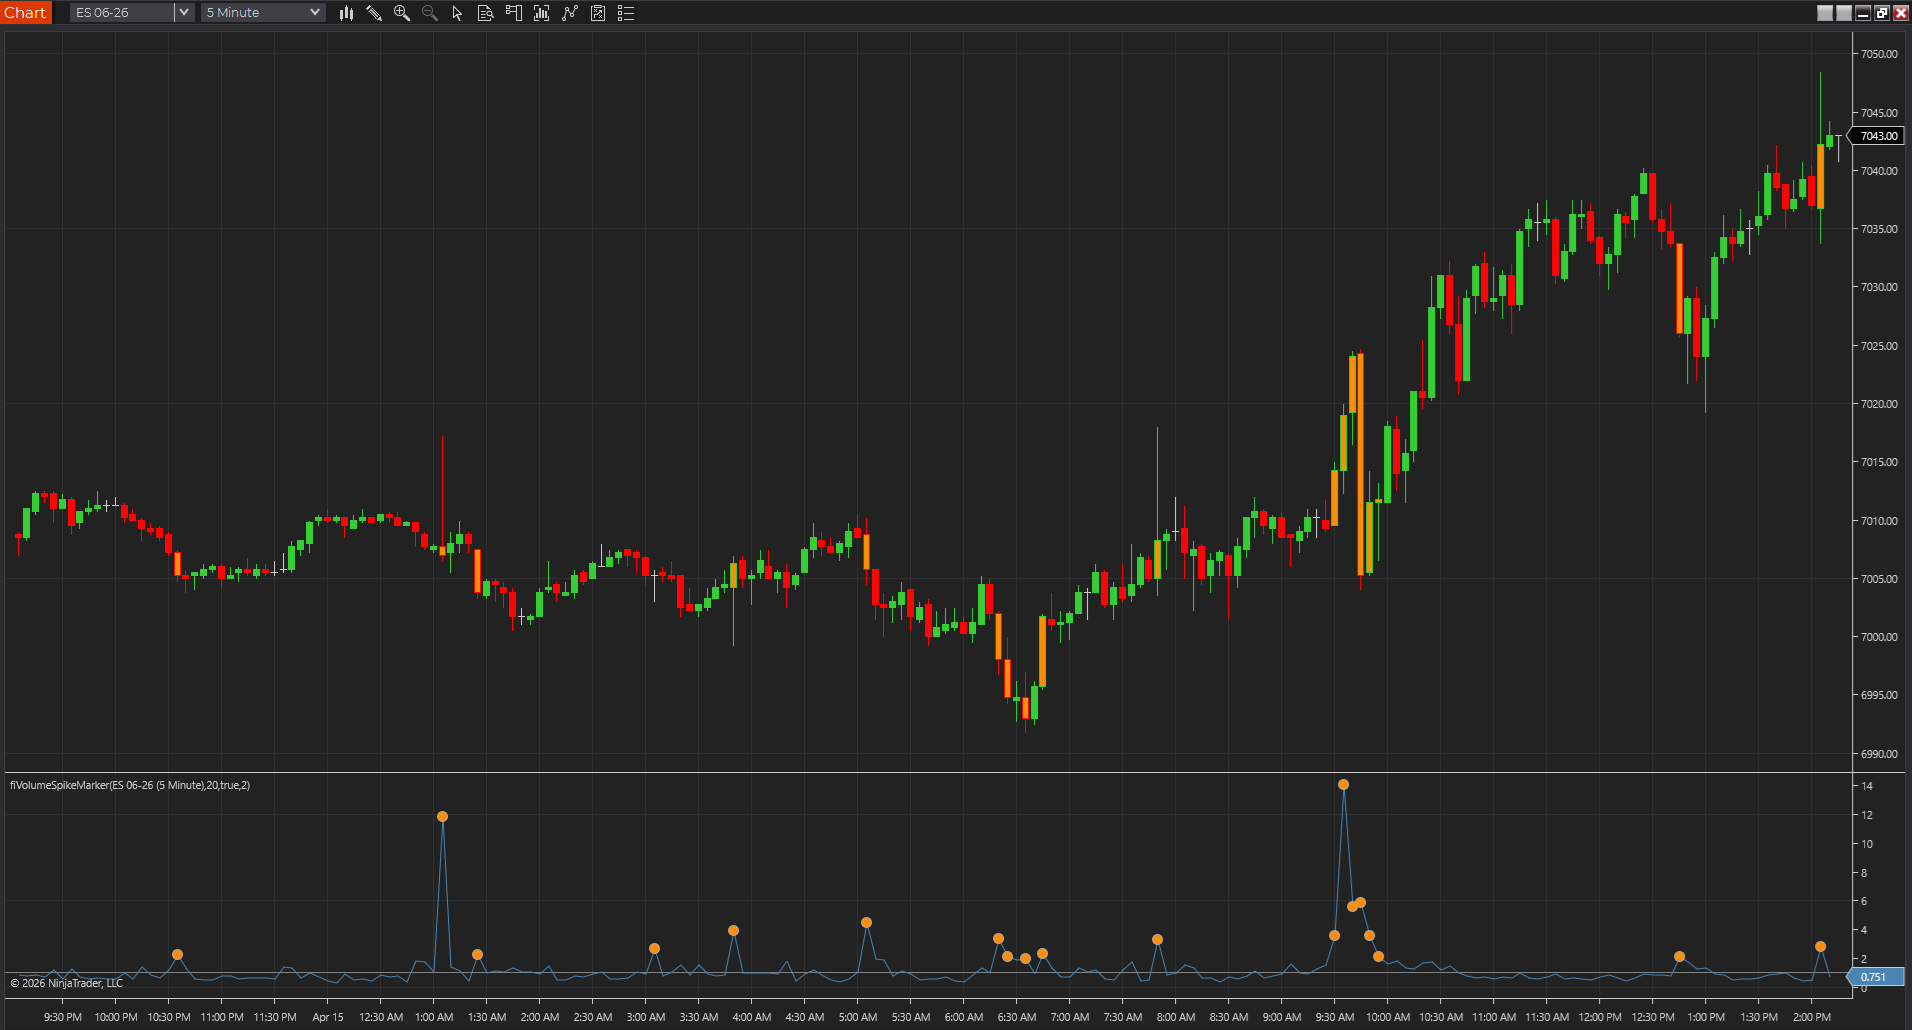
Compares current volume to recent average volume and highlights bars that are doing meaningfully more business than normal.
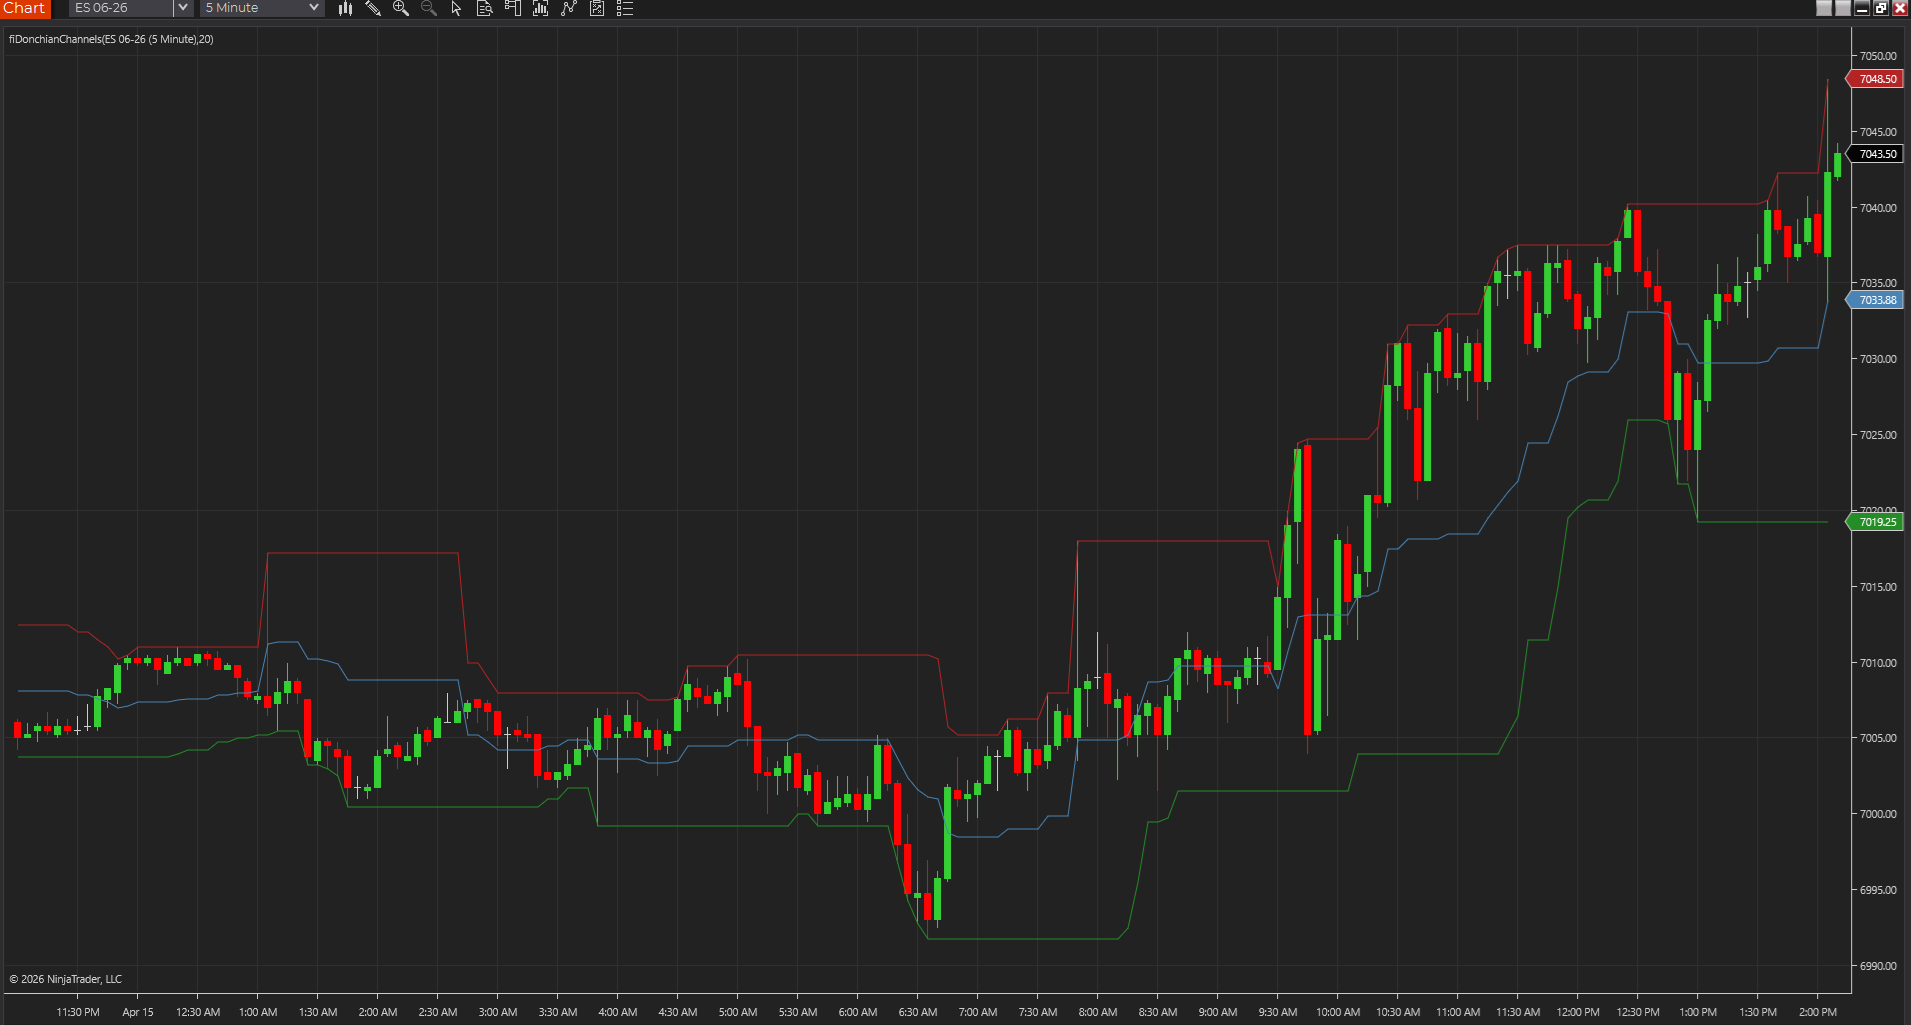
Plots the recent lookback high, low, and midpoint so breakout boundaries and range context stay obvious.
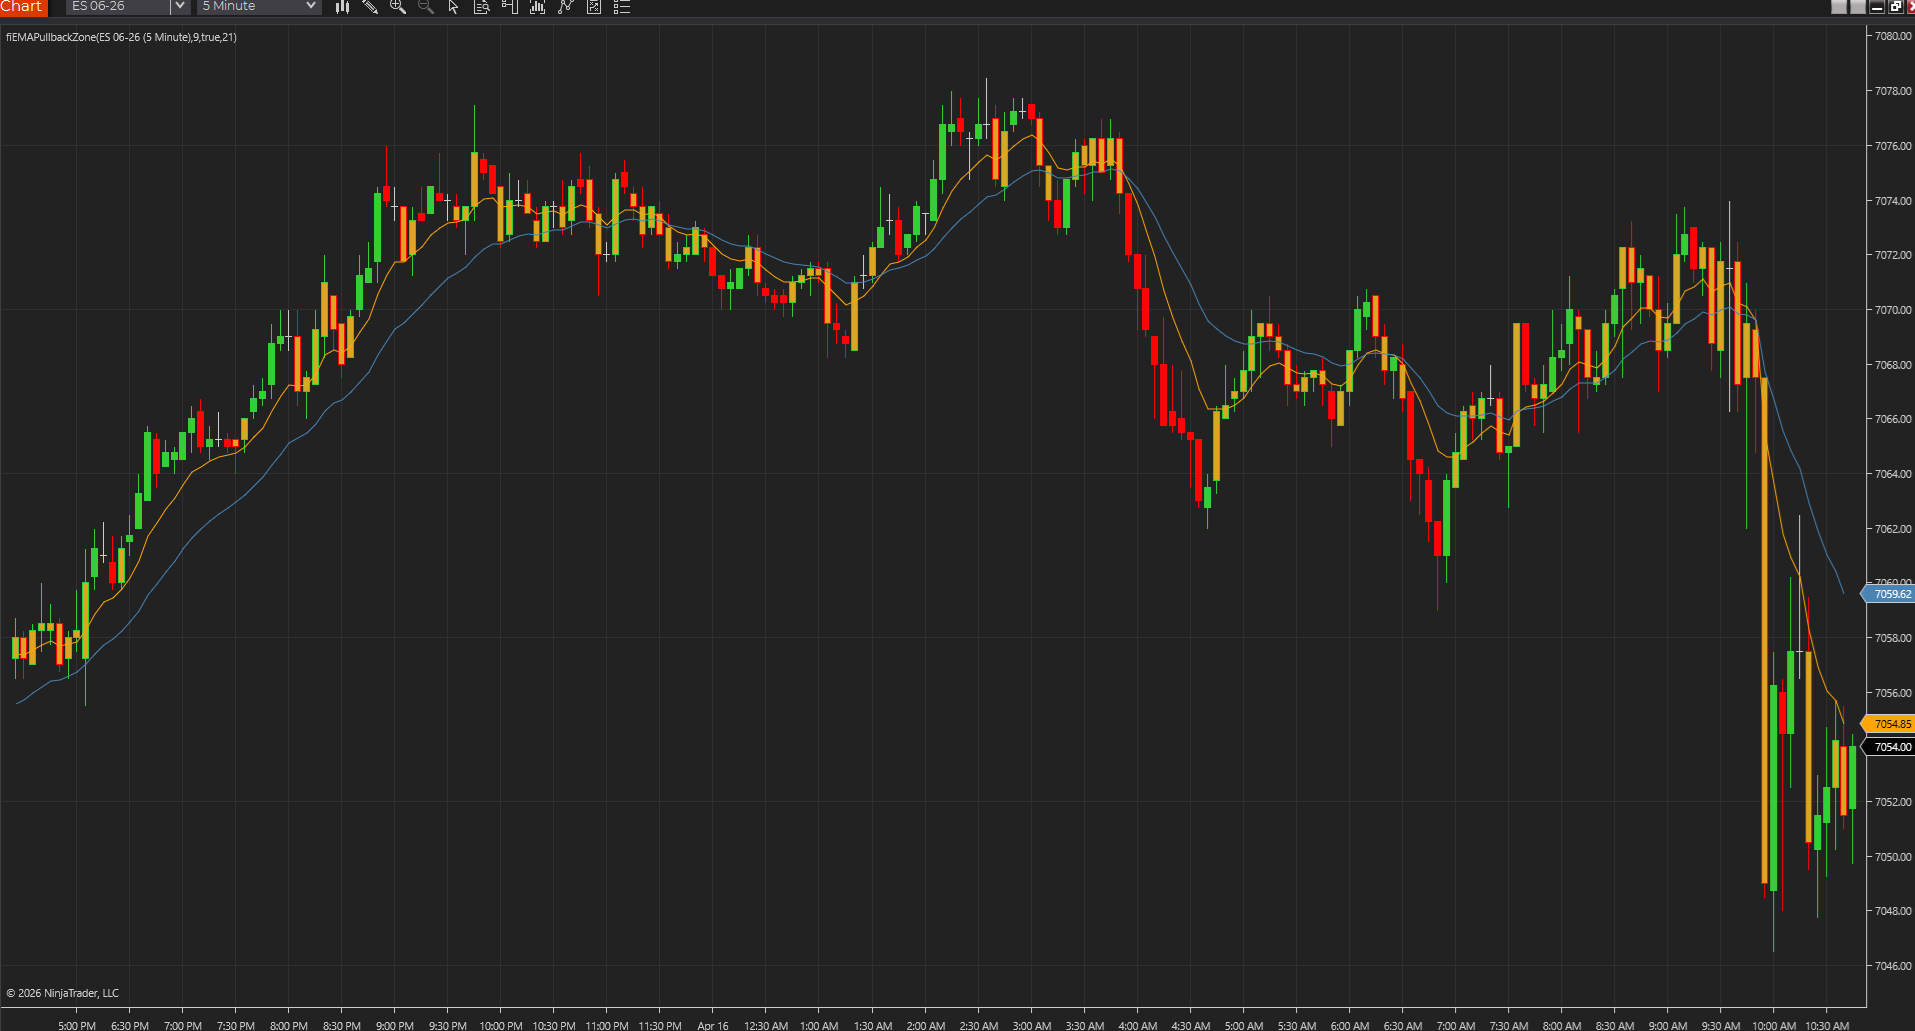
Plots a fast and slow EMA zone so traders can see where trend pullbacks are landing instead of guessing around a single average.
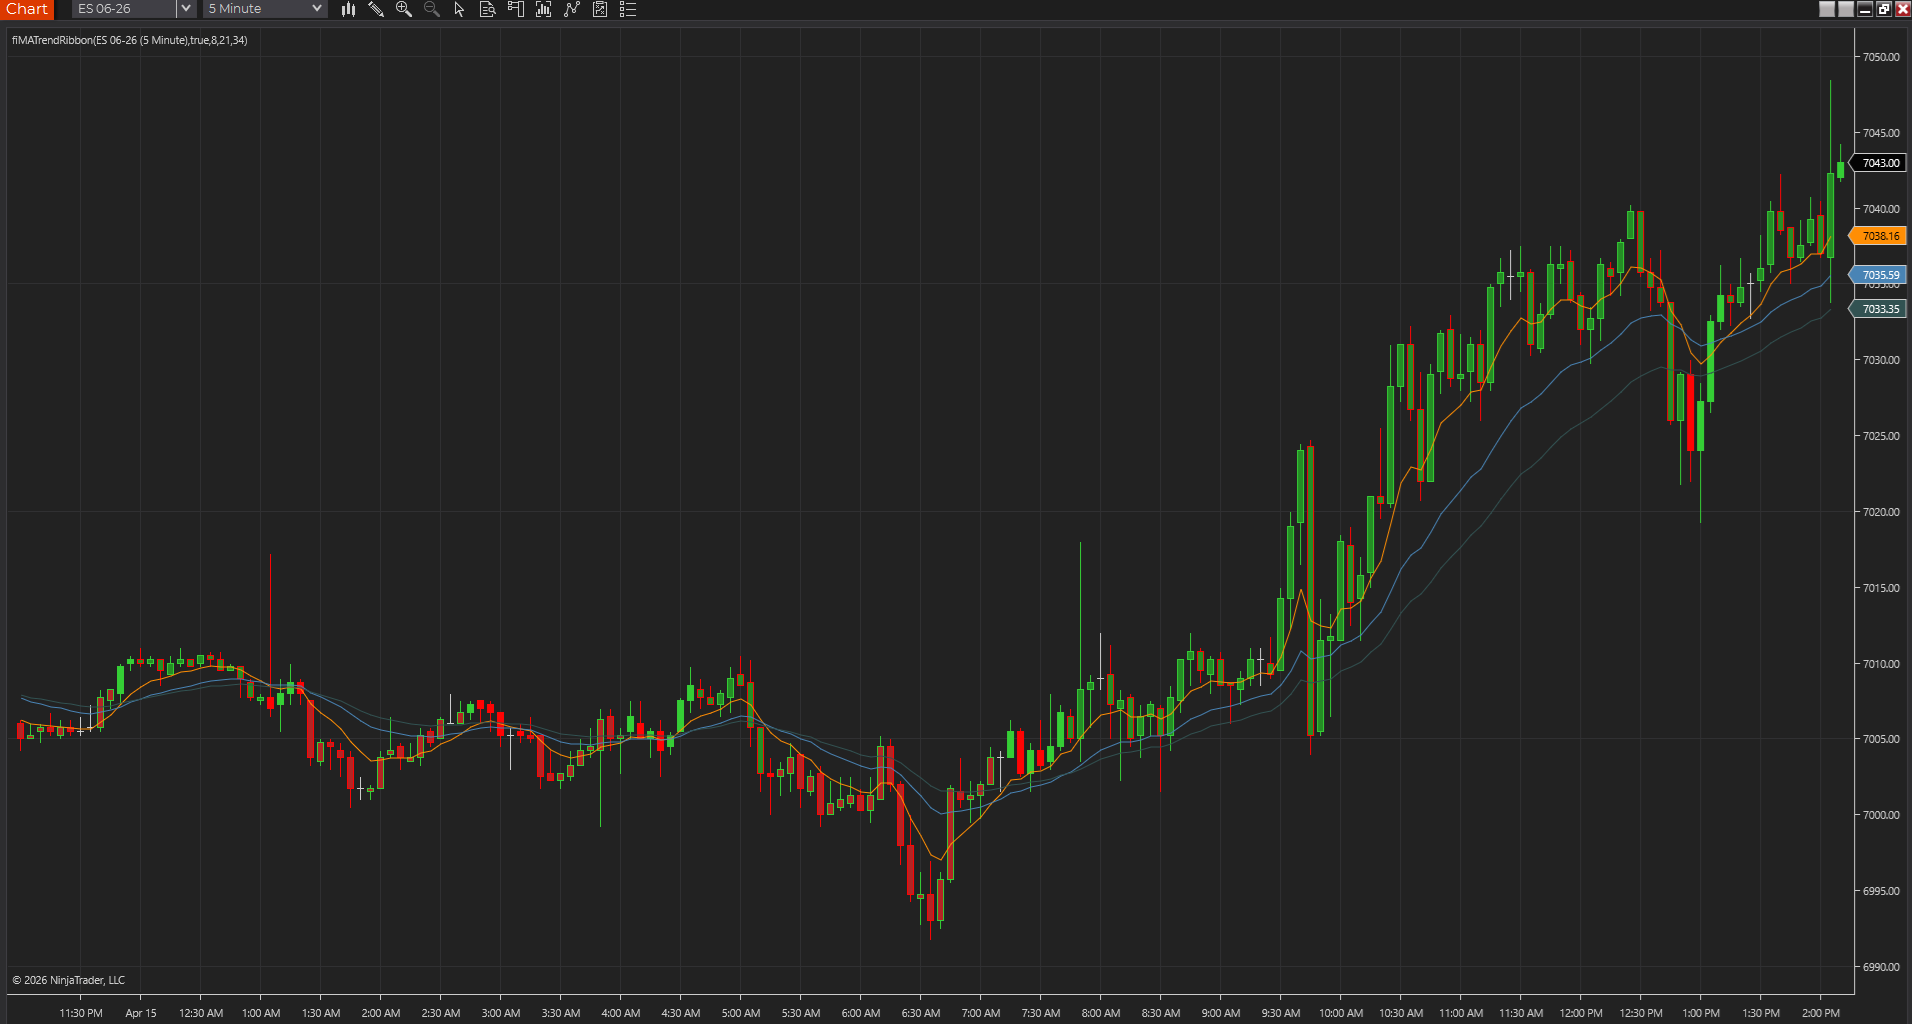
Plots fast, medium, and slow EMA lines so short-term trend alignment or compression is easier to read.
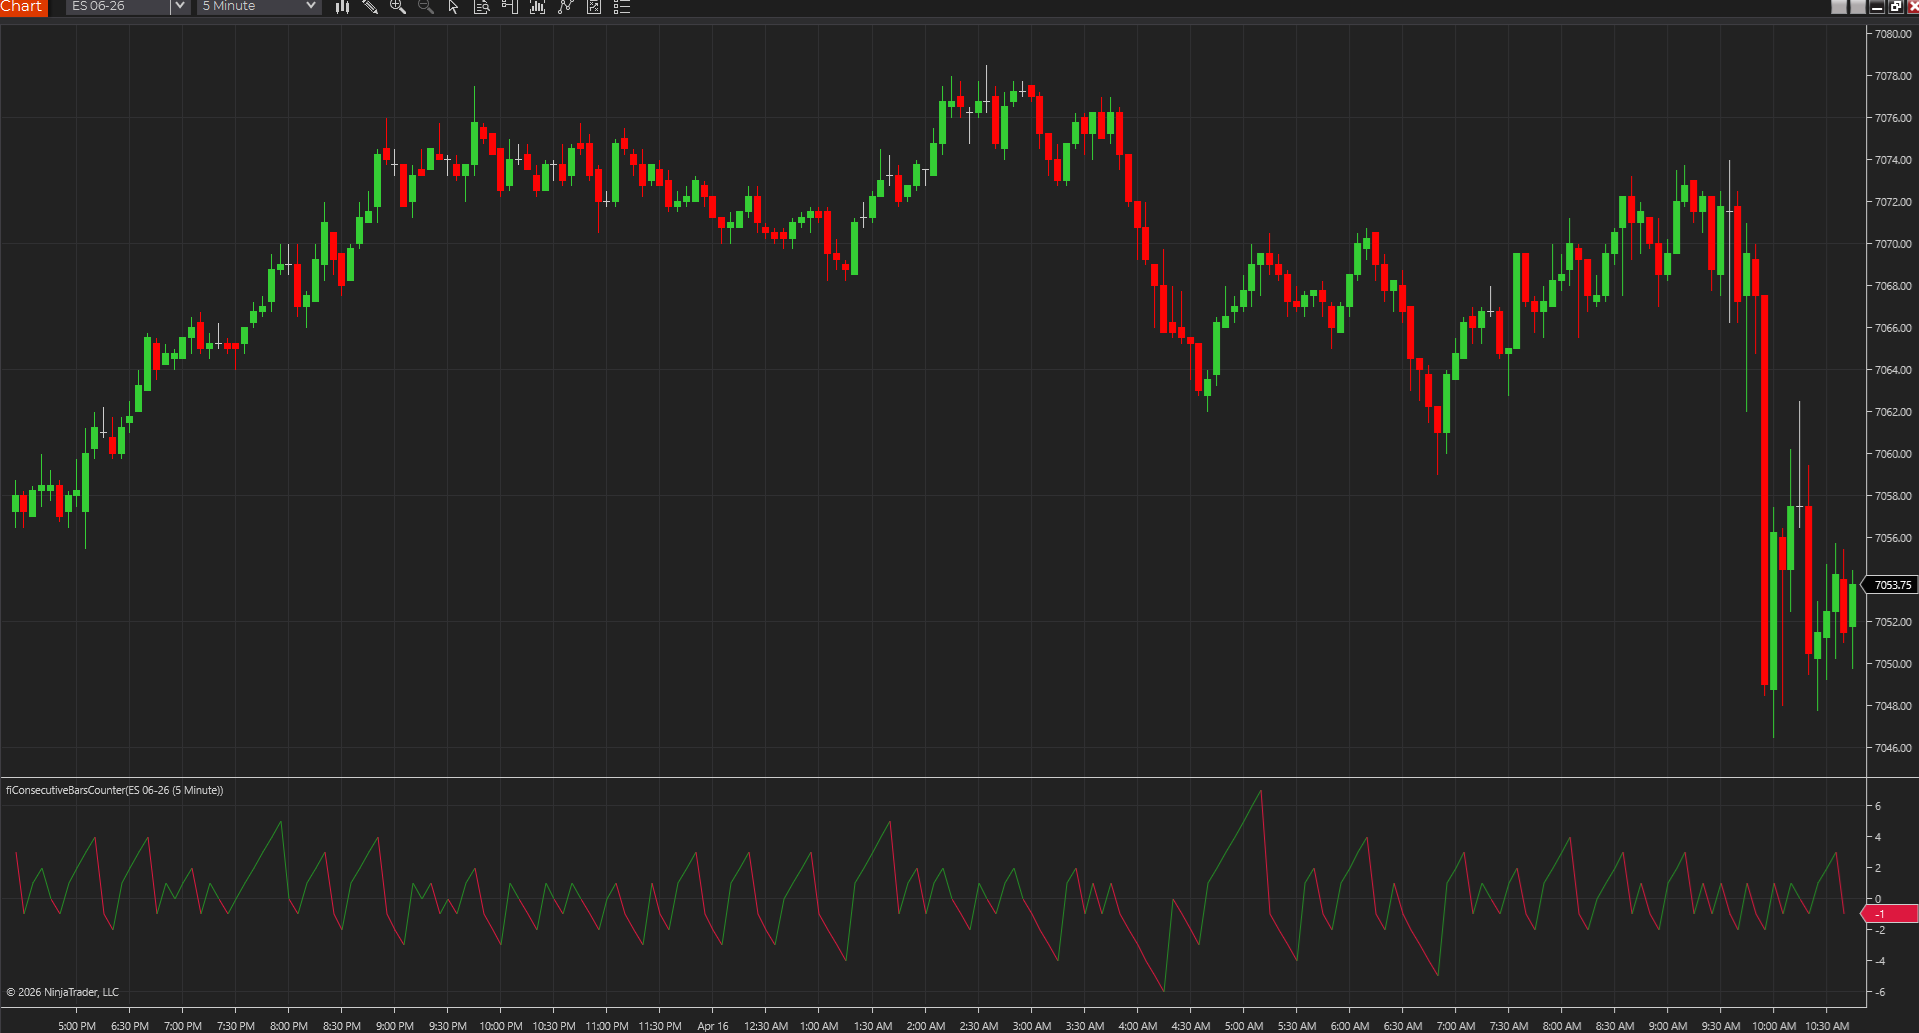
Counts consecutive higher-close and lower-close bars so traders can see short-term streaks instead of eyeballing every candle sequence.
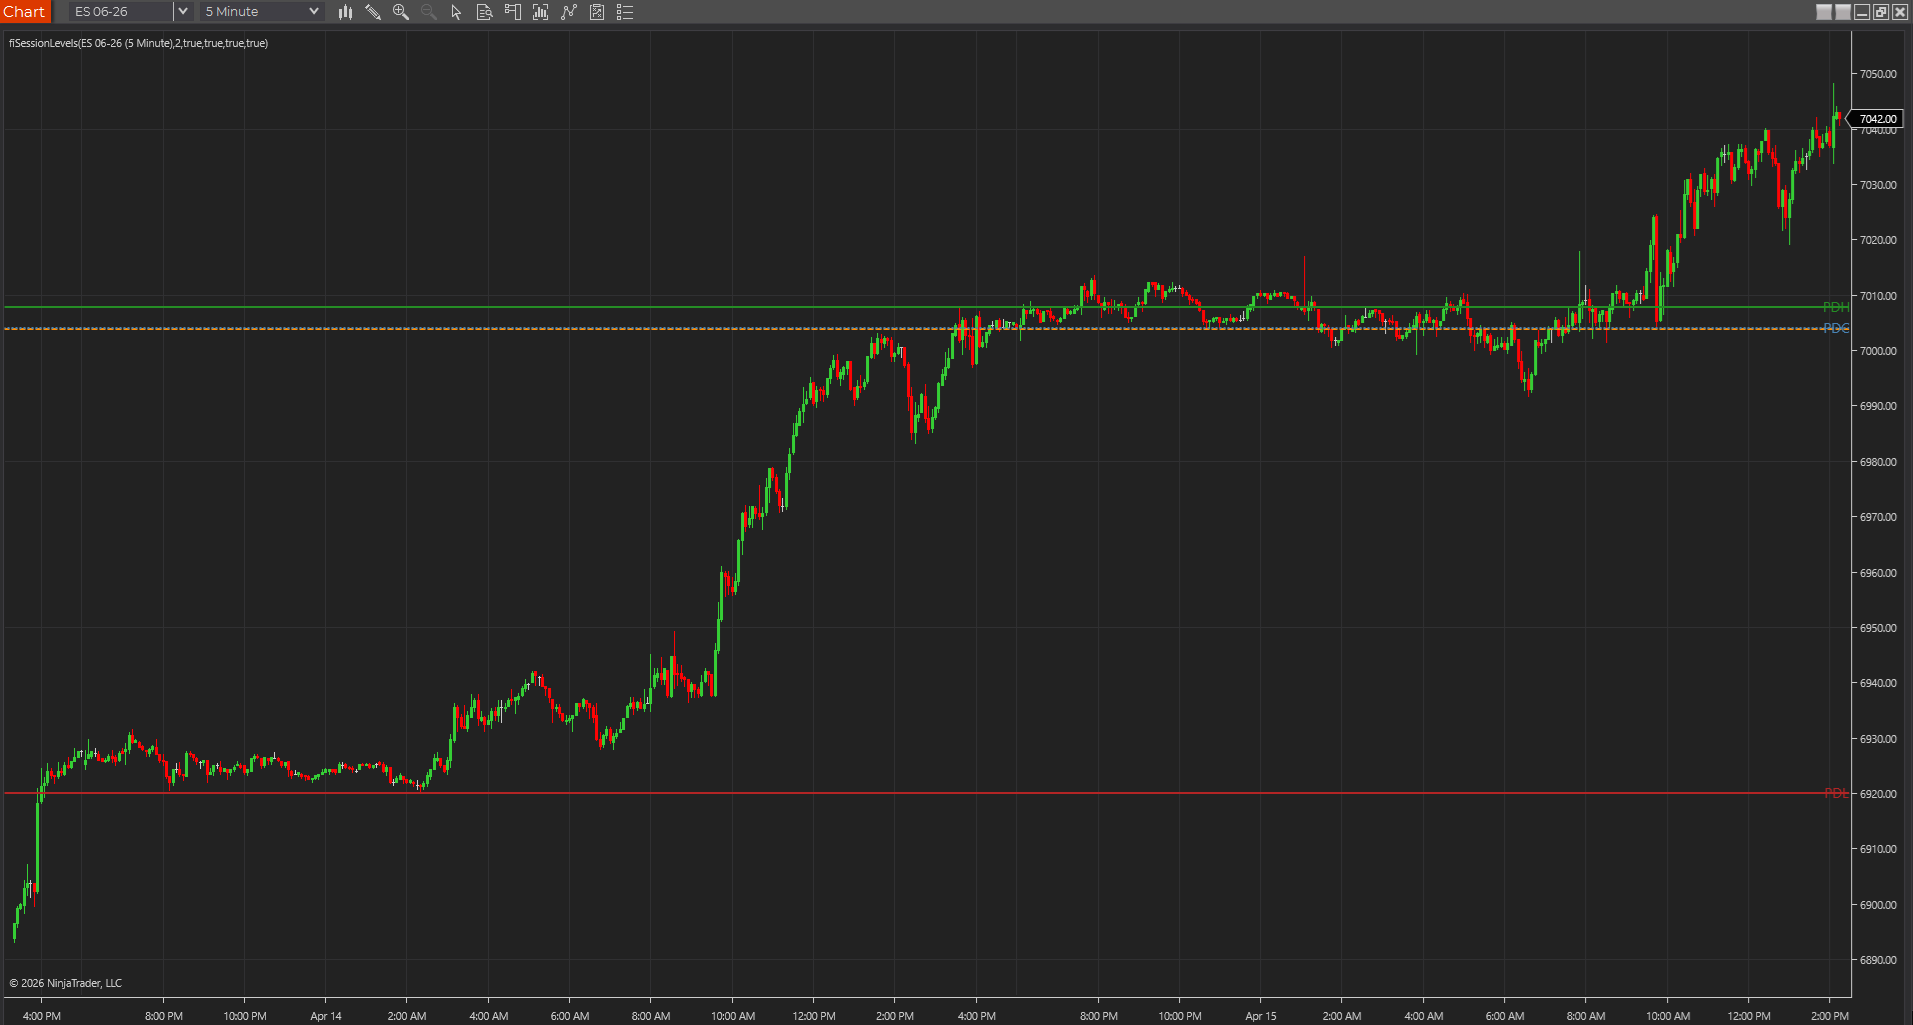
Keeps prior-session highs, lows, close, and the current session open visible so the chart has a cleaner intraday auction map from the start.
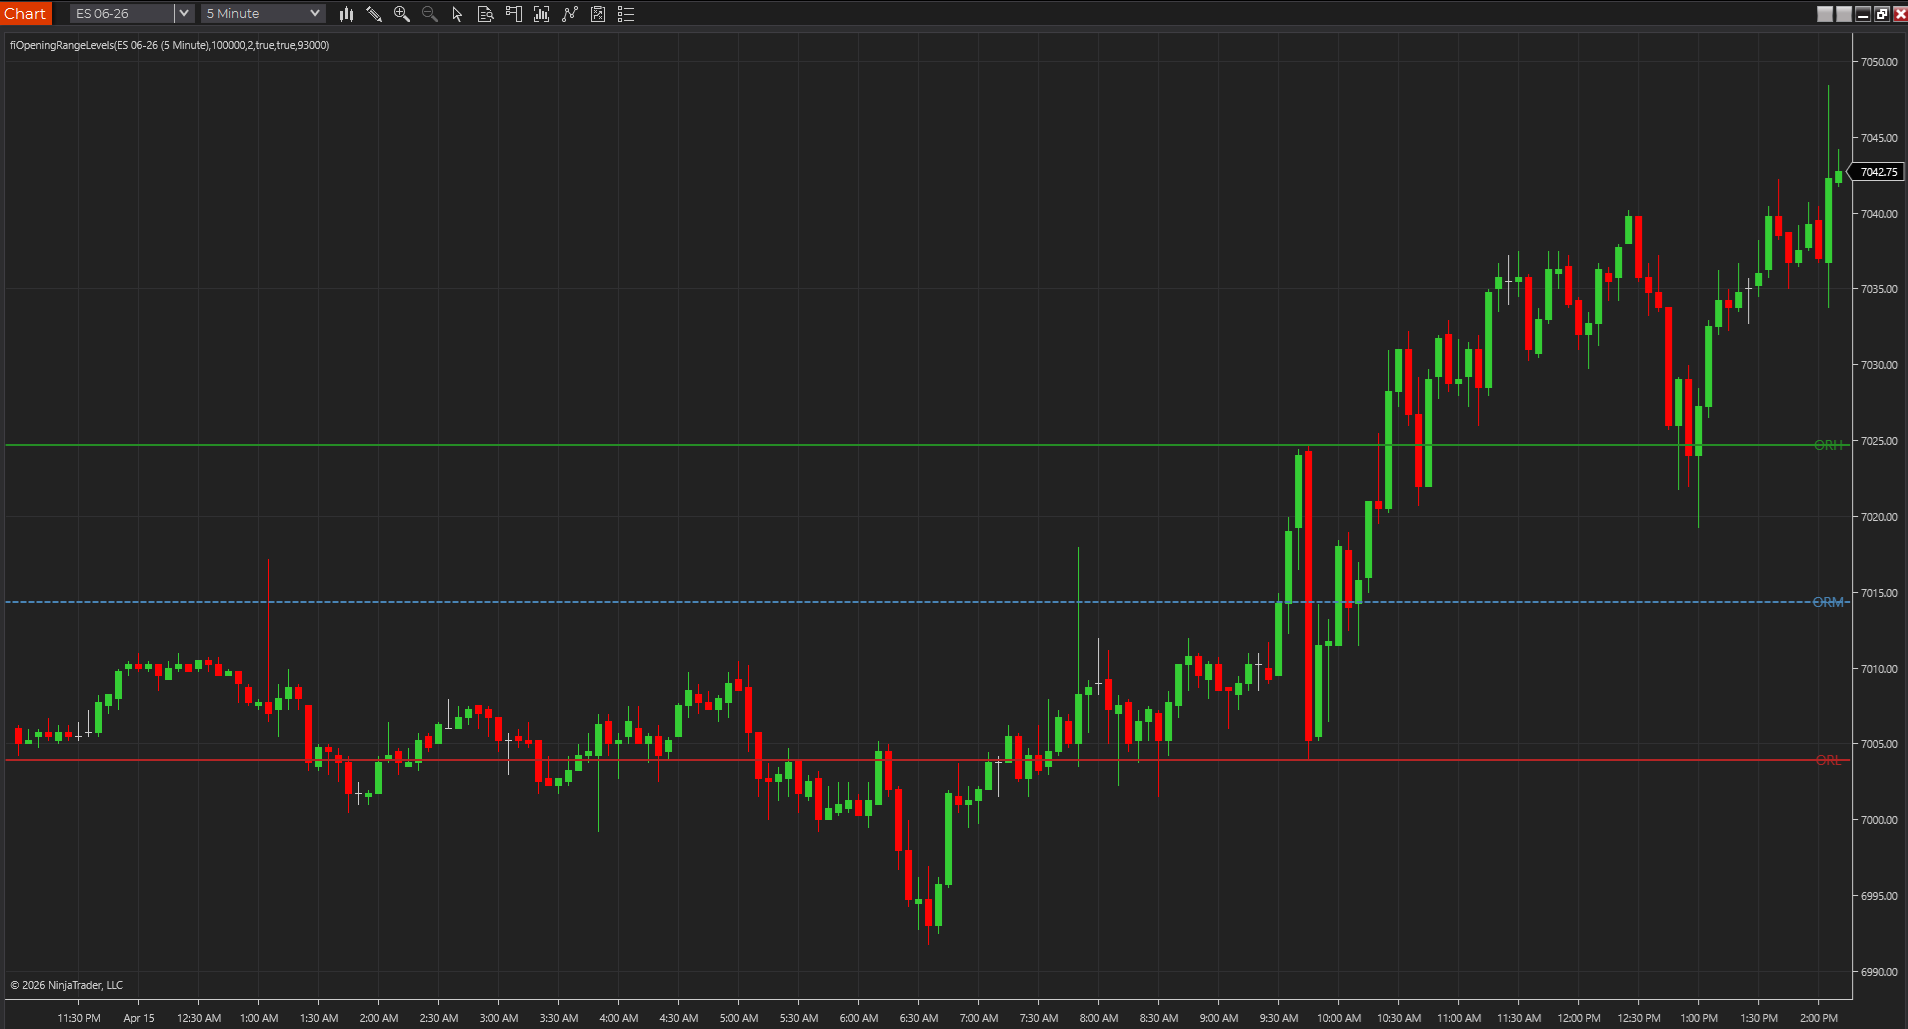
Marks the opening range high, low, and midpoint so traders can frame the first session expansion before deciding whether a breakout deserves attention.
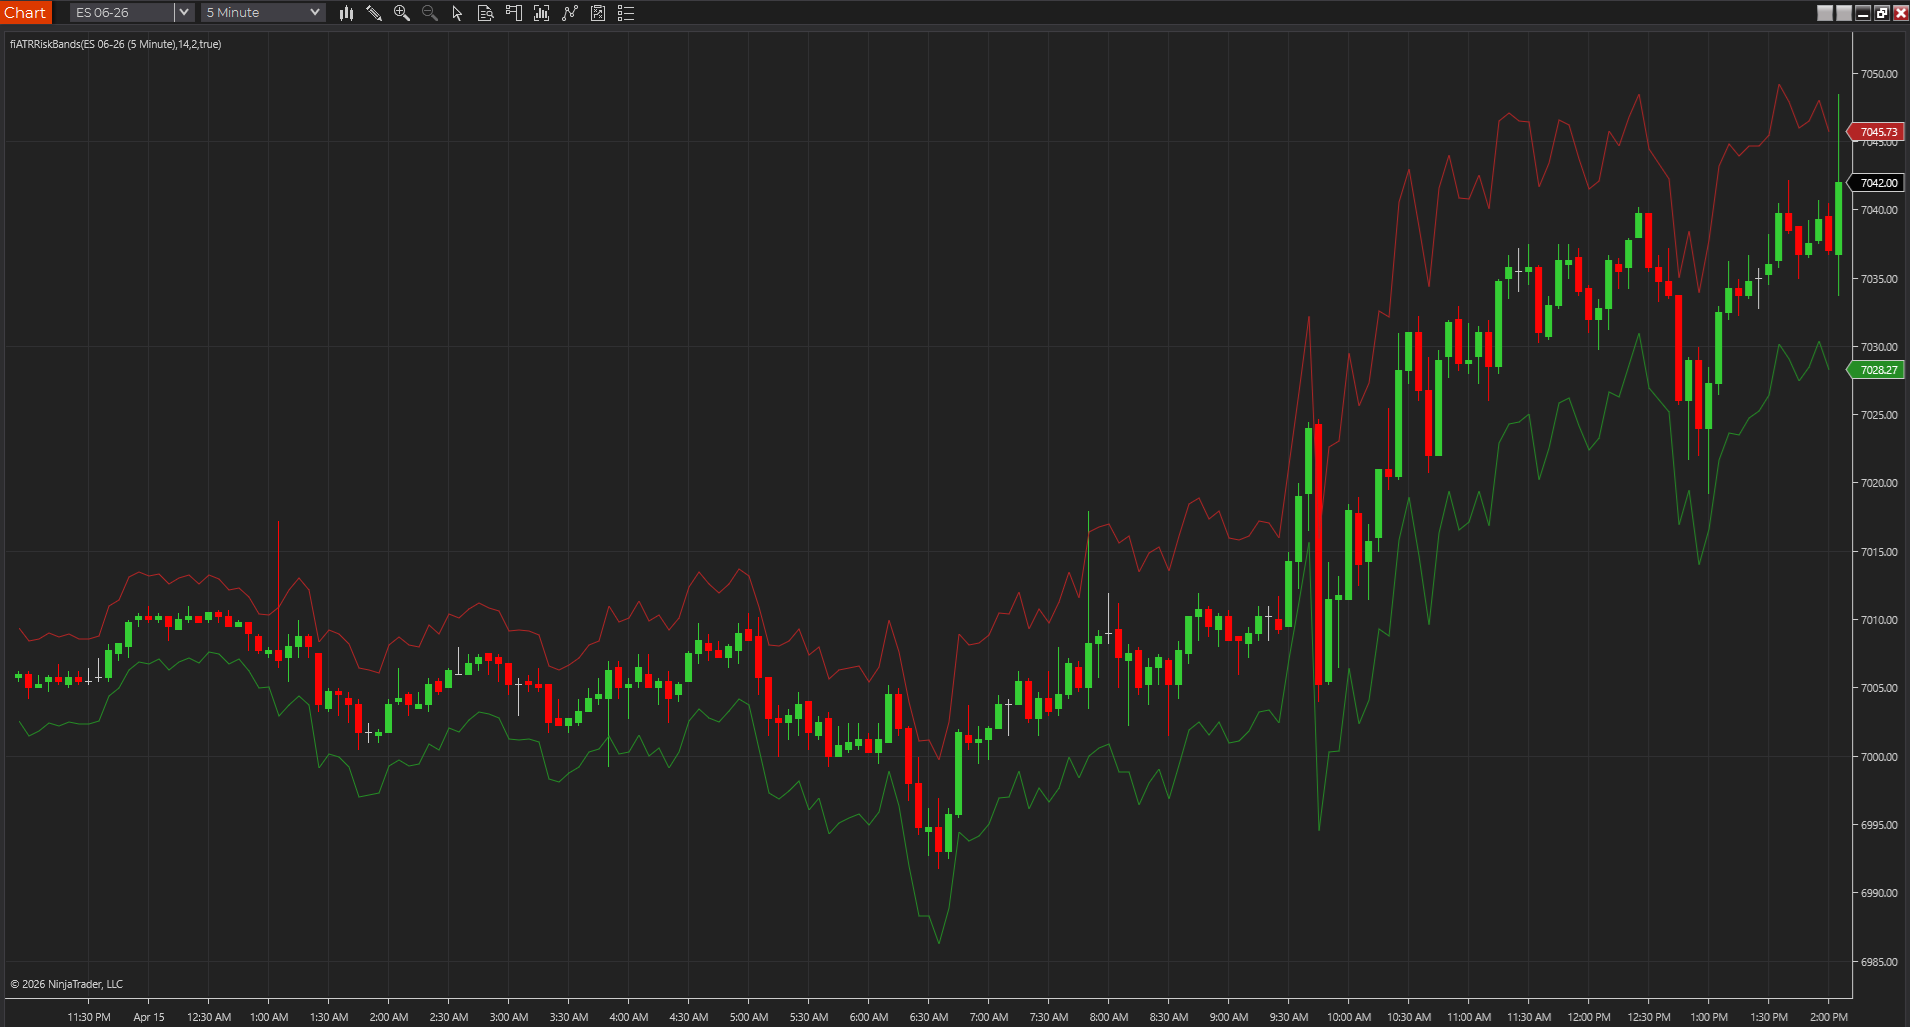
Plots a volatility envelope around price so traders can judge breathing room, stop distance, and stretch with less guesswork than a fixed-tick mindset.
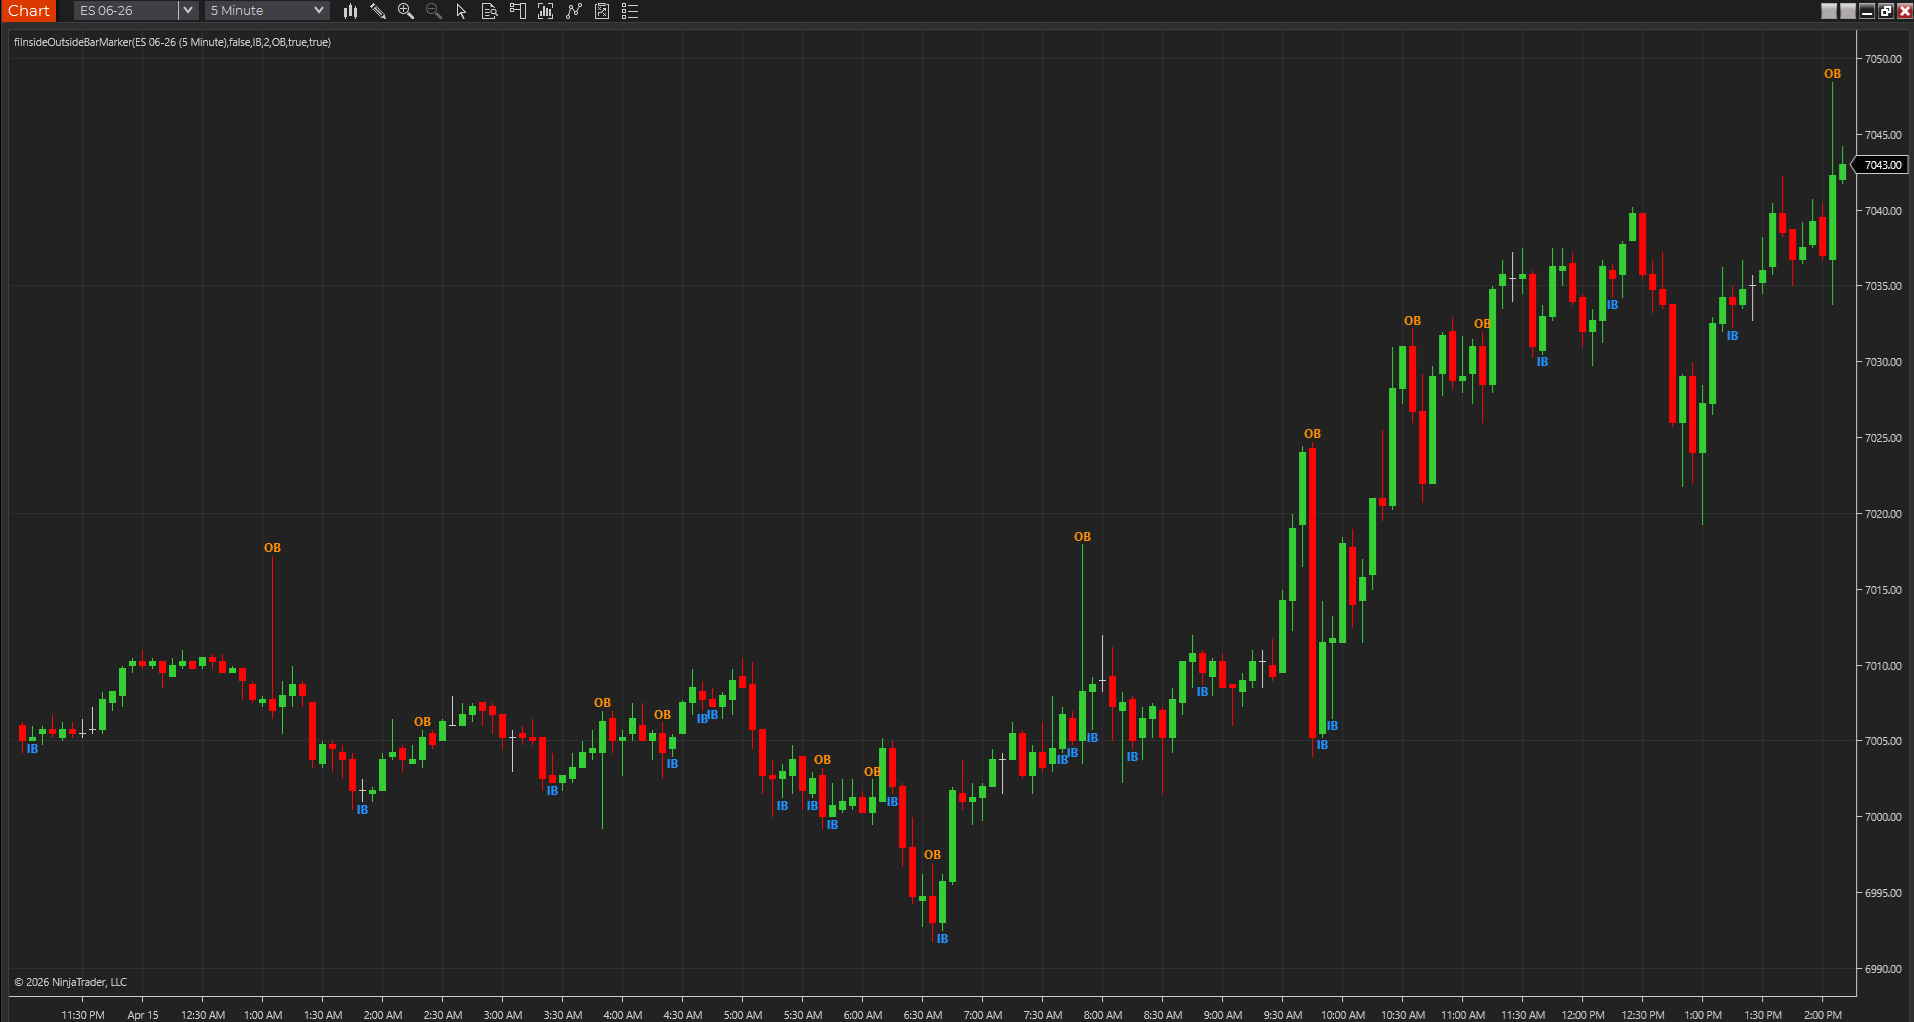
Marks inside and outside bars directly on price so compression and expansion patterns stand out without forcing traders to scan every candle manually.
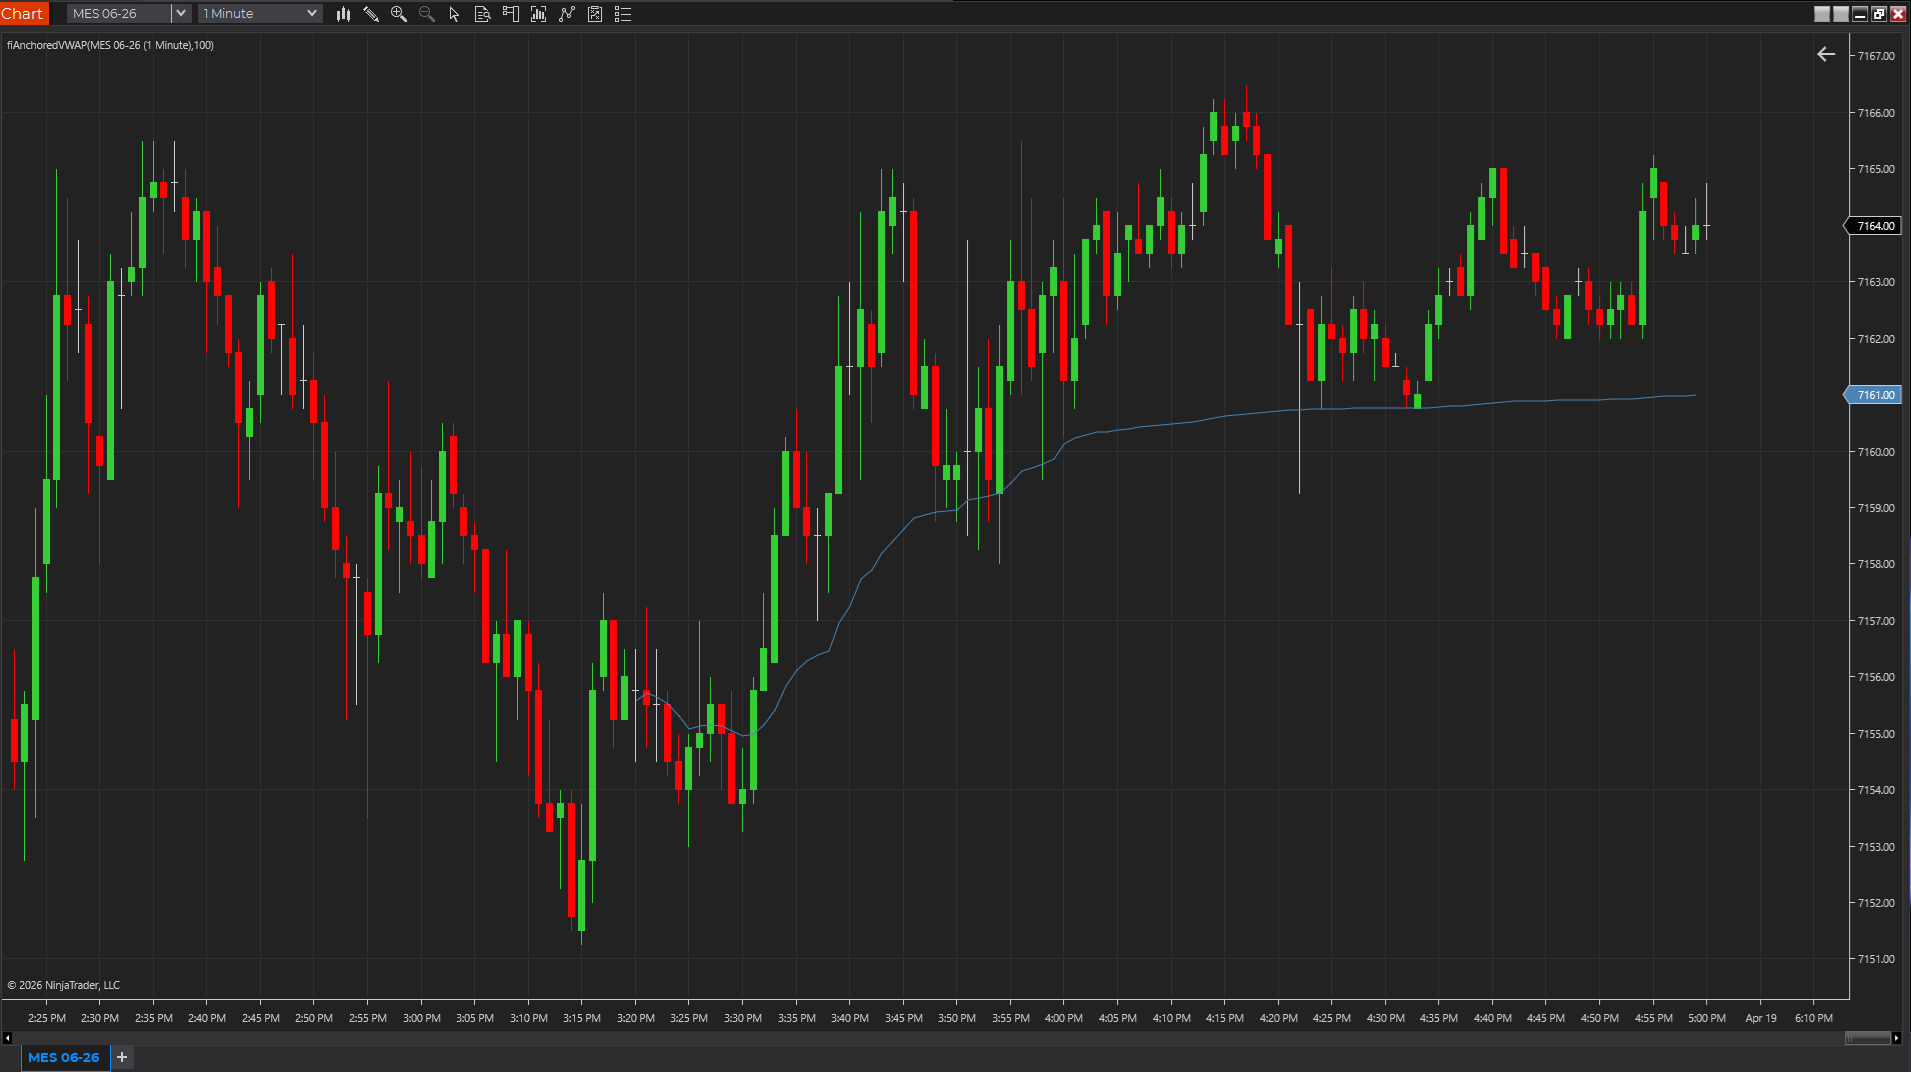
Starts VWAP from a fixed bars-ago anchor so traders can compare current price against a single historical reference instead of the session open alone.
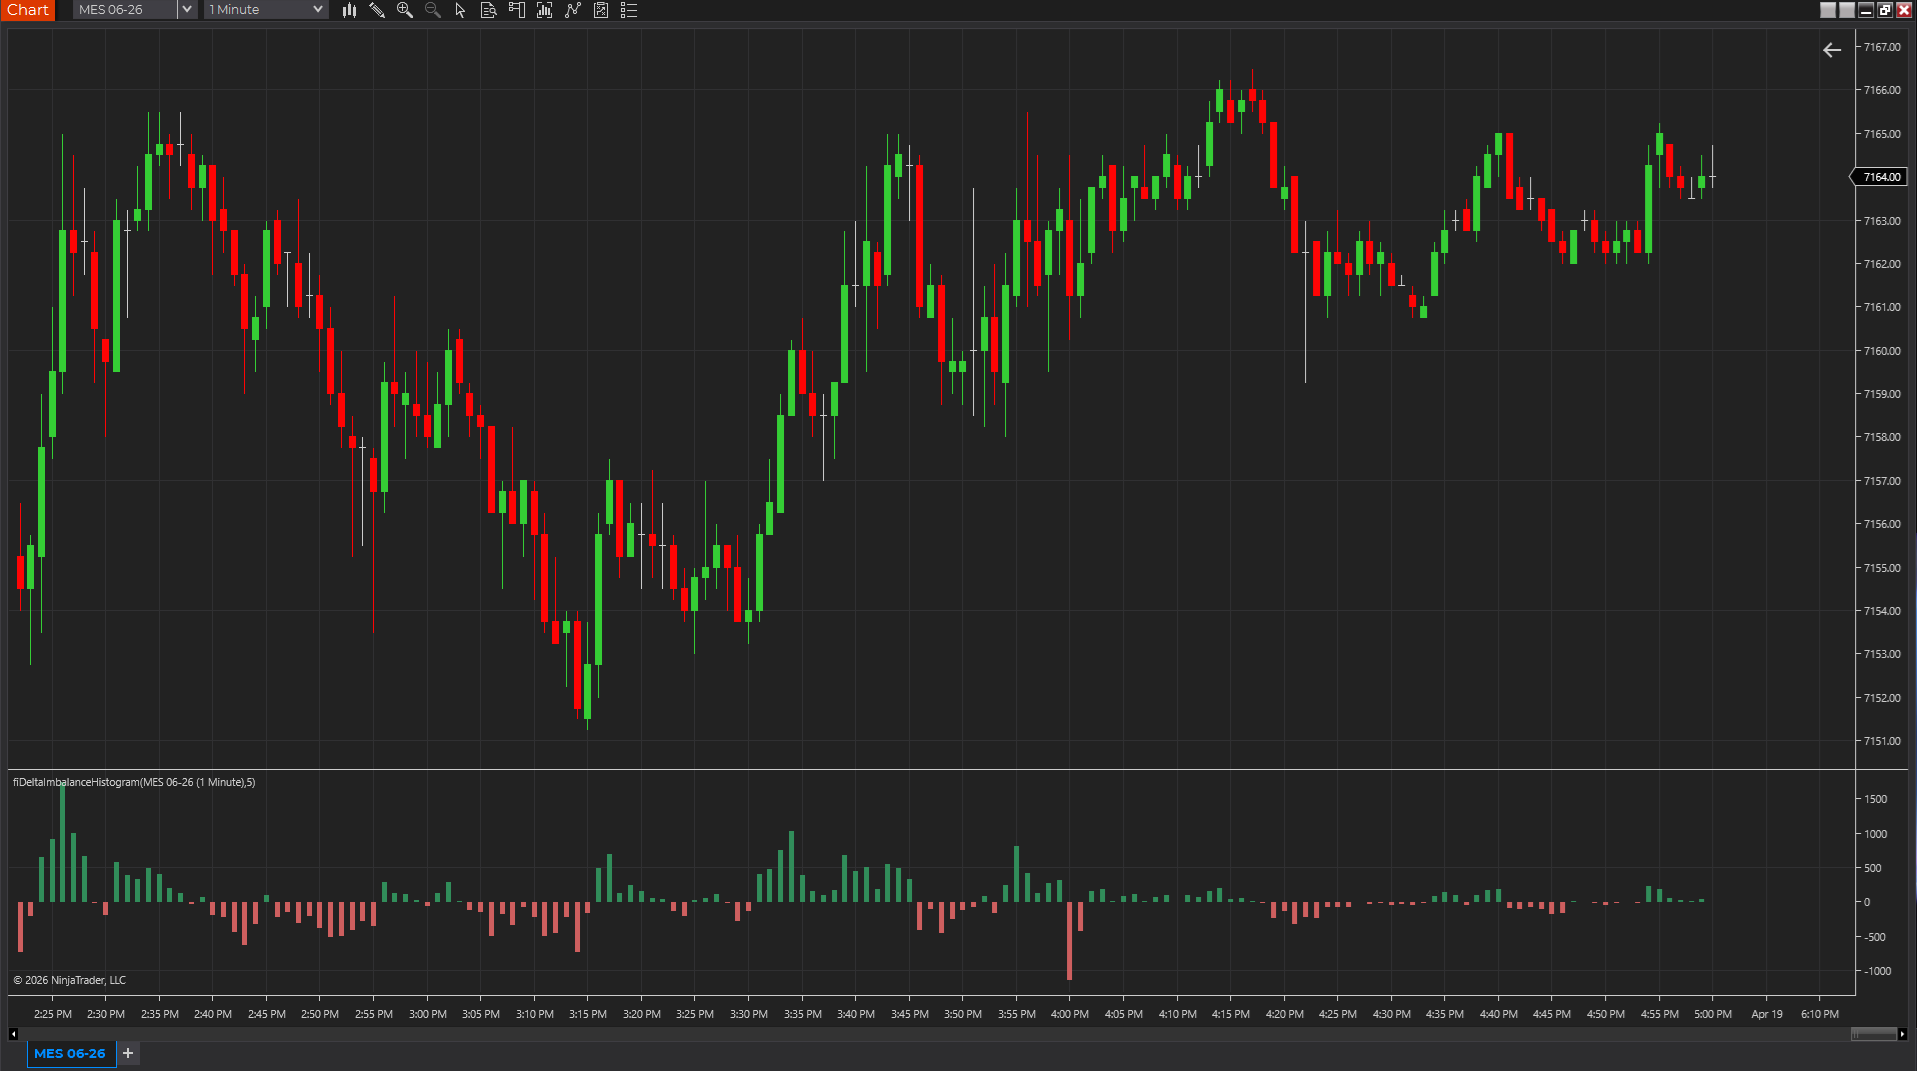
Uses candle body, range, and volume as a lightweight pressure proxy so traders can see whether momentum is skewing positive or negative without a full footprint feed.
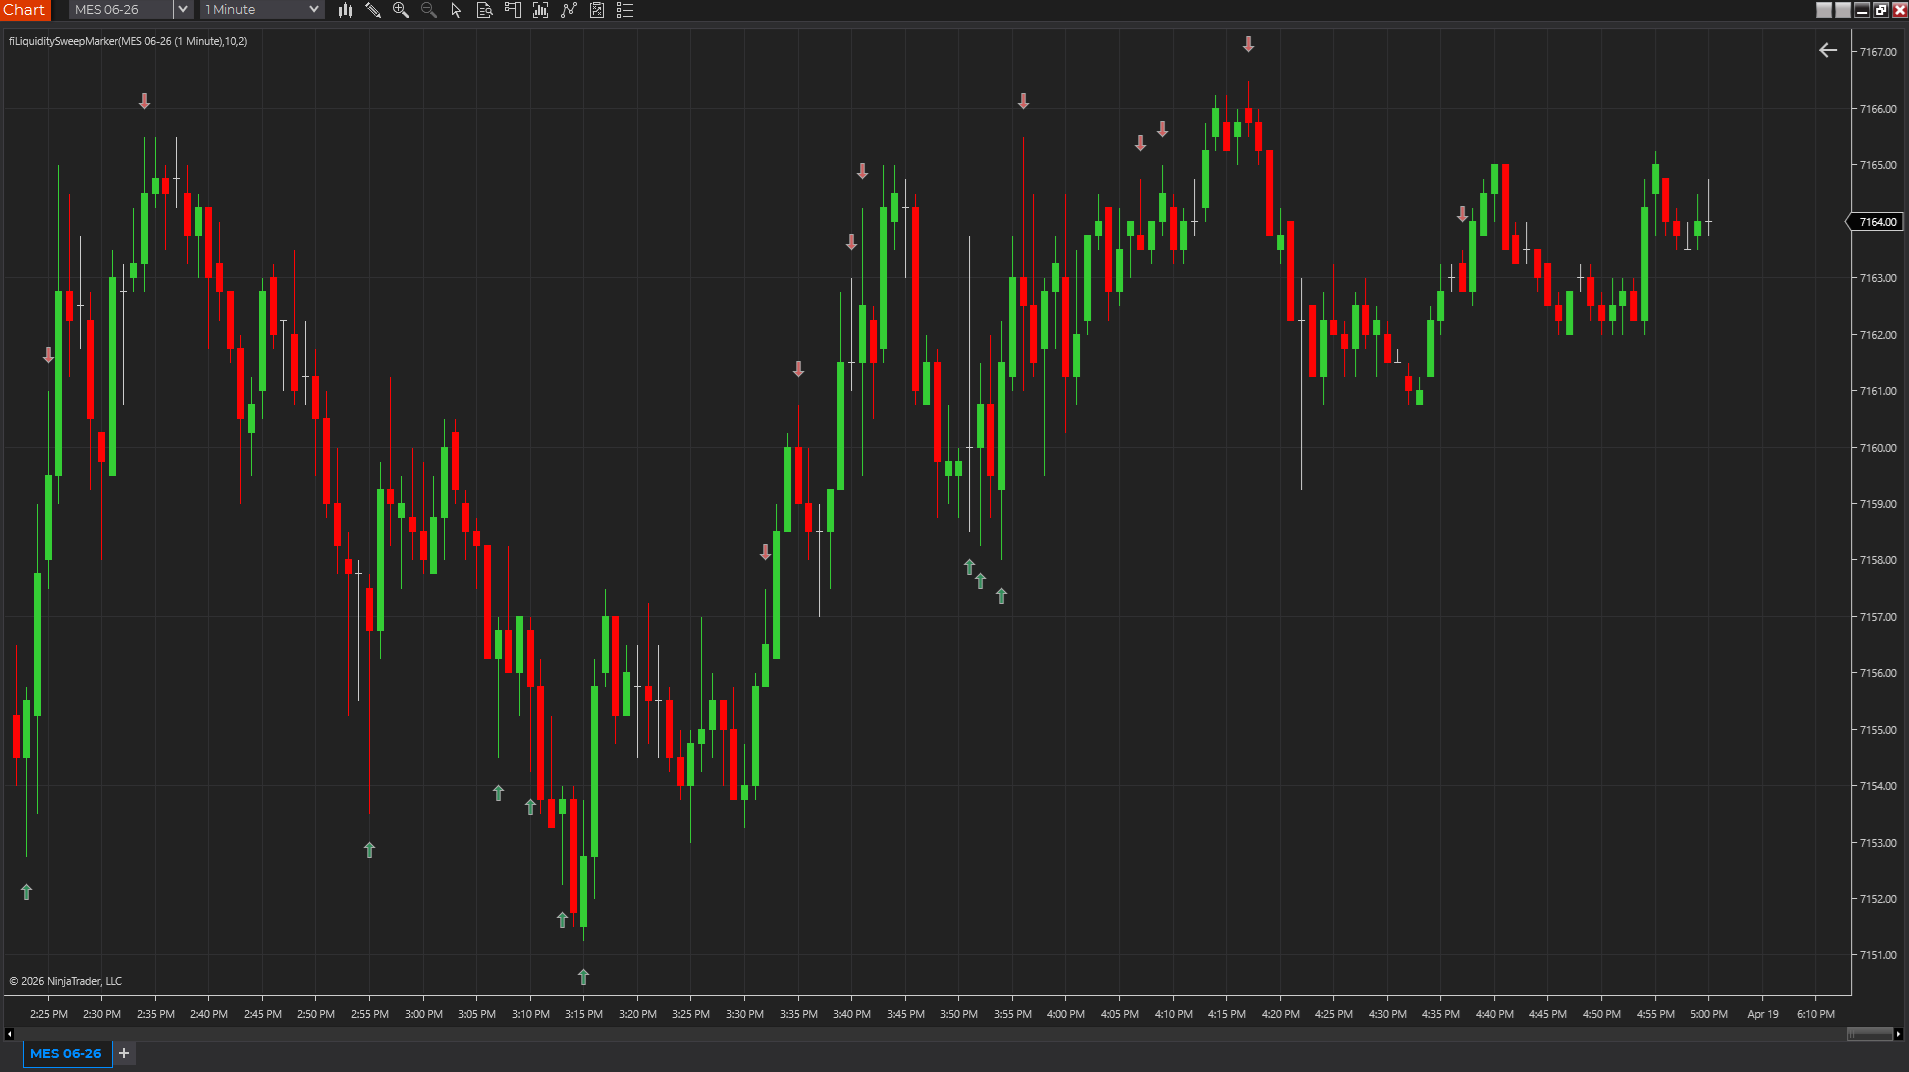
Marks sweeps of recent highs or lows so traders can separate genuine continuation from stop-clearing probes that quickly snap back into range.
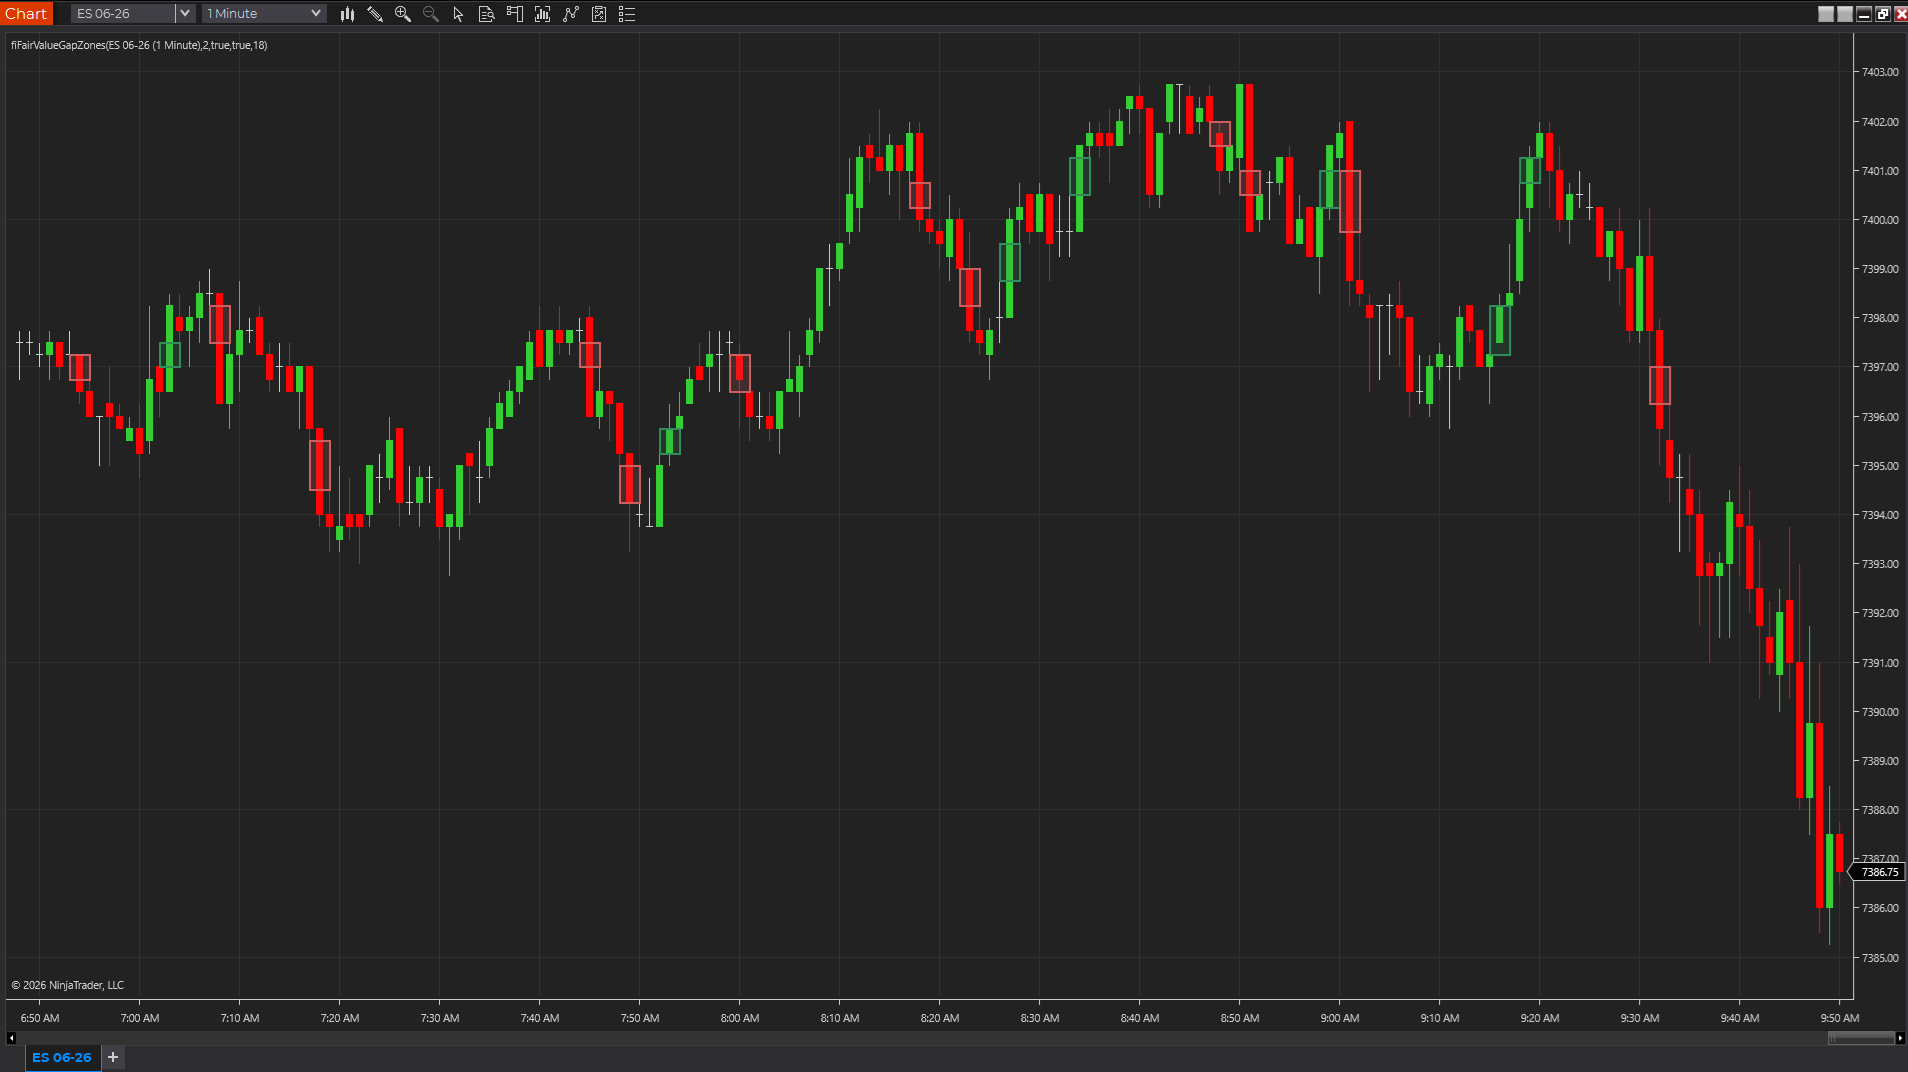
Draws bullish and bearish three-candle fair value gap zones so displacement gaps stay visible while price revisits or ignores them.
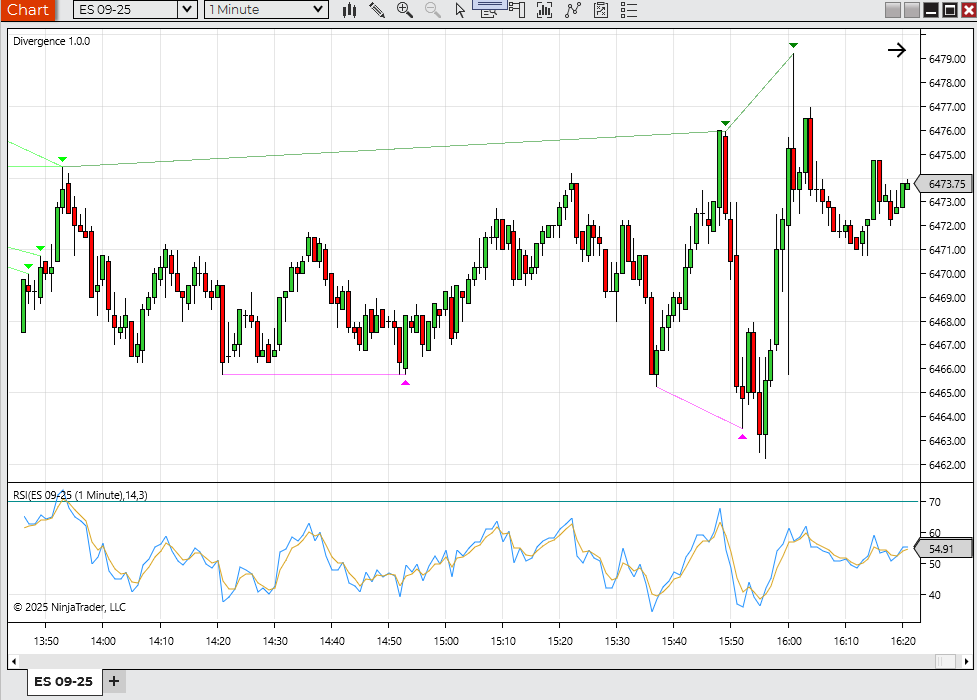
Marks regular bullish and bearish RSI divergence when price makes a new confirmed swing extreme but RSI fails to confirm the move.
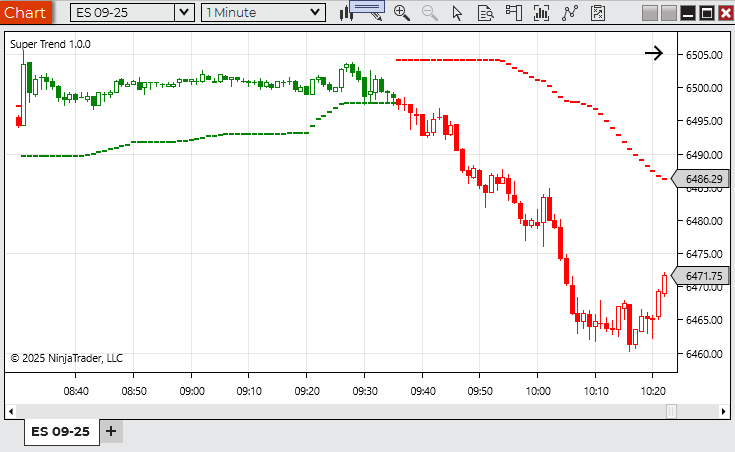
Plots an ATR-based trend stop line that flips color when price closes through the active trailing level.
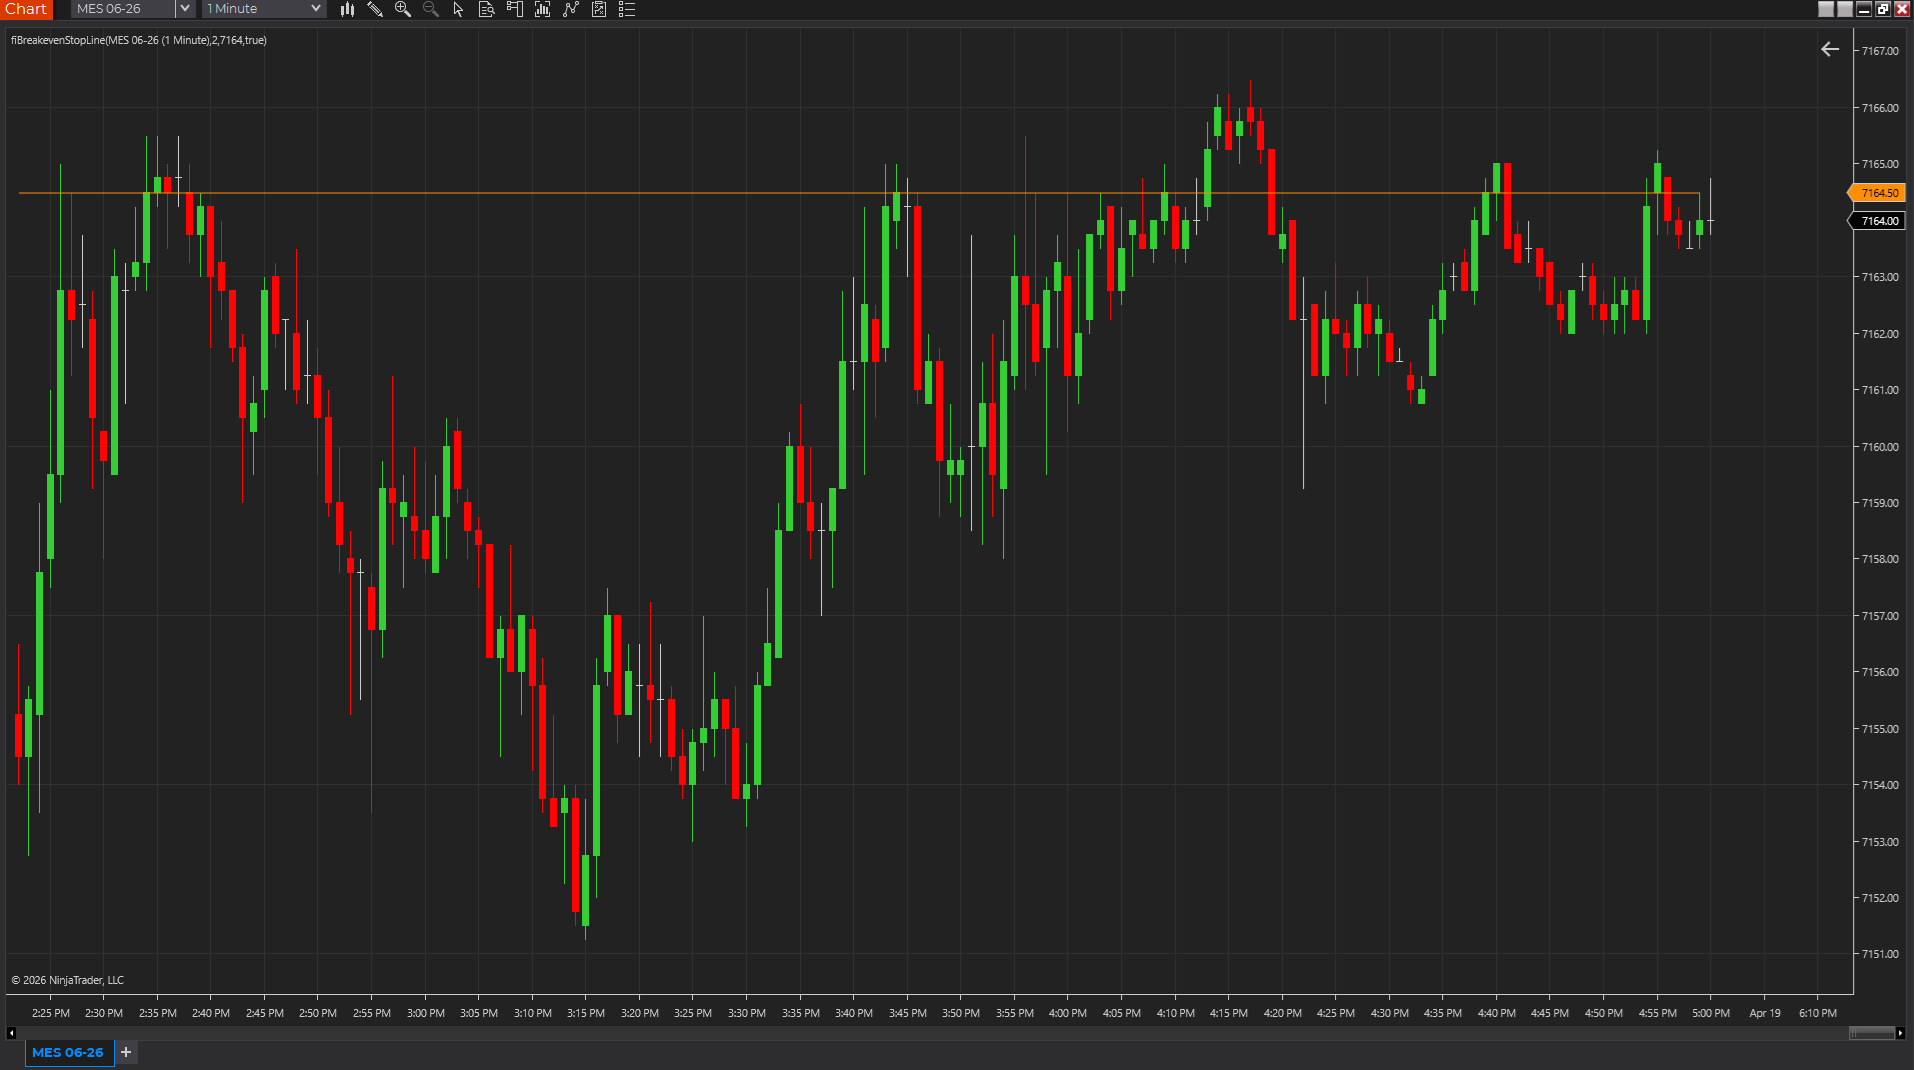
Keeps the trade’s breakeven price visible on chart so stop movement decisions stay tied to actual cost and position context instead of gut feel.
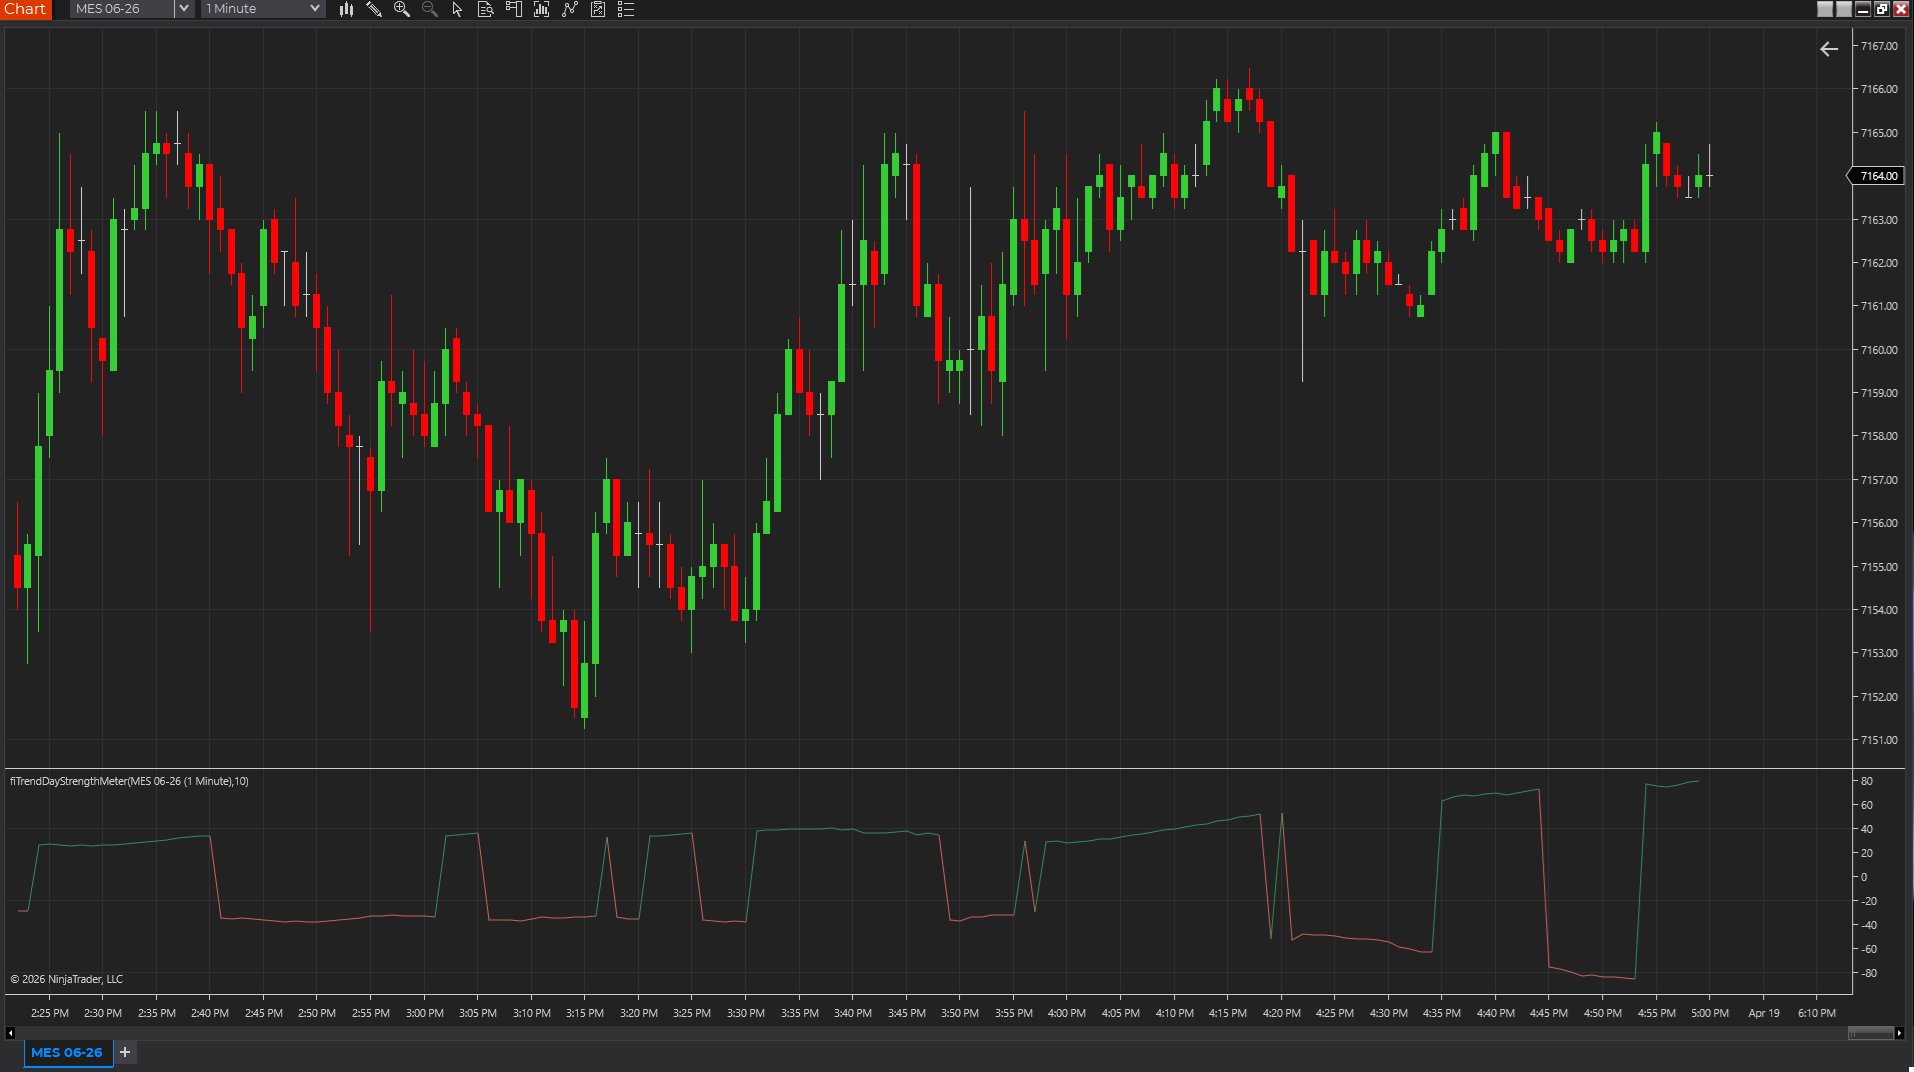
Scores whether the session is stretching away from its open with enough persistence to behave more like a trend day than a balanced chop session.
No indicators match those filters yet.

Sample trading plan
Best for traders who want the free indicator plus an example of how the levels and scenarios can be framed before the session starts.
The signup form could not load in this browser.
Join by emailUses Constant Contact for delivery. Expect a sample plan, selective planning emails, and occasional workflow updates. Review the privacy policy.
Before you leave
Best for traders who want the free indicator plus a cleaner idea of what to prepare for before the session.
The signup form could not load in this browser.
Join by emailUses Constant Contact for delivery. Expect a sample plan first, then selective planning emails. Review the privacy policy.