What it does
Moving Average Trend Ribbon gives traders a compact read on short-term average alignment. It is useful as a quick trend filter when you want to know whether the ribbon is stacked cleanly or starting to compress.
Who this is for
This page is a good fit for traders who want a readable Moving Average Trend Ribbon workflow without having to reverse-engineer the setup from forum posts or screenshots.
Key terms for this tool
Review the core trading and platform terms tied to this page before changing settings or using the study in a live workspace.
What it is not
Moving Average Trend Ribbon is a chart-context tool. It does not place trades, manage risk automatically, or promise that a specific pattern will resolve in one direction. Use it to organize decisions, not to outsource them.
Chart examples
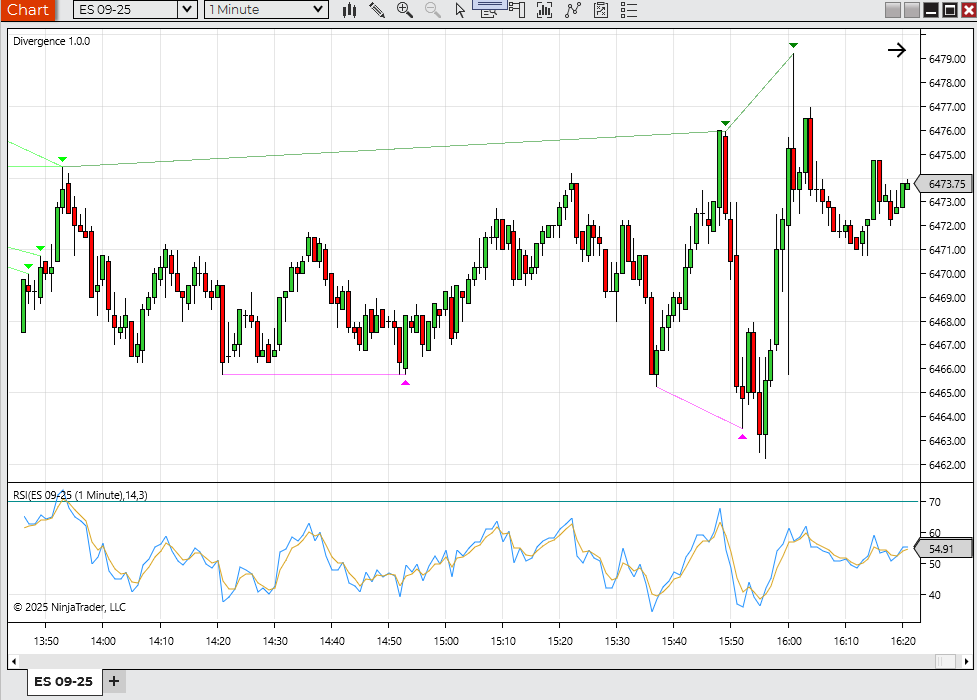
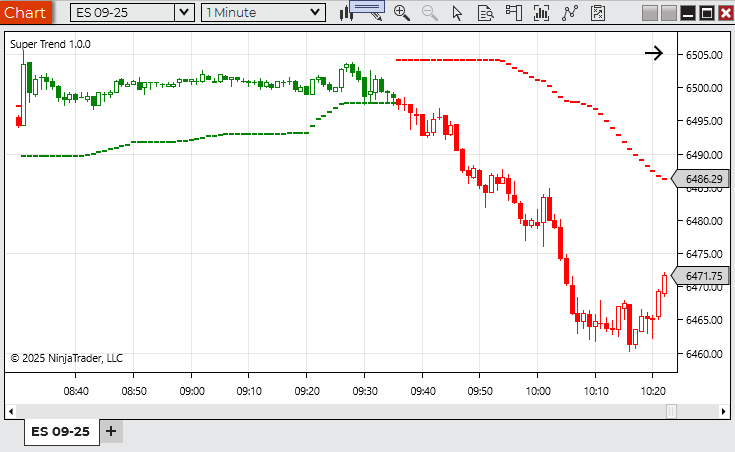
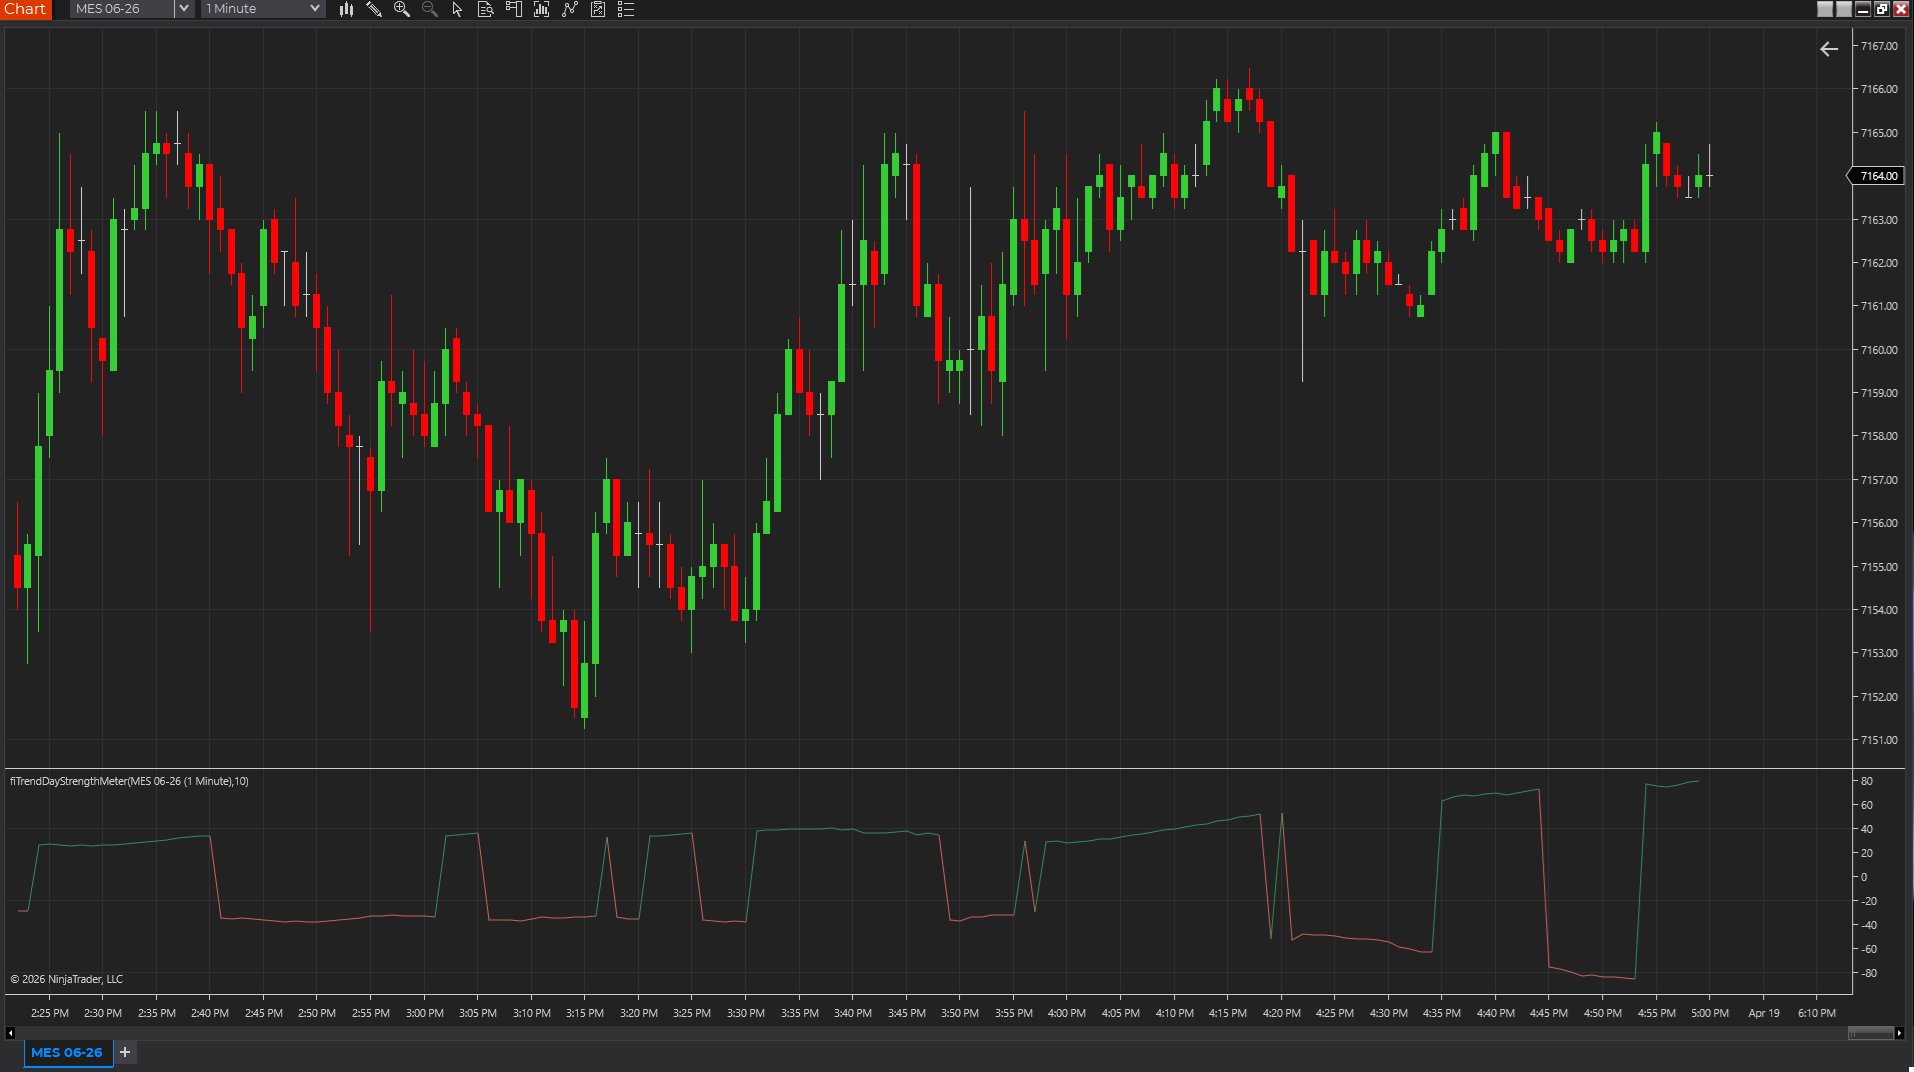
This chart capture shows the study on a real NinjaTrader workspace. Use it as visual reference, then confirm behavior on your own instrument, session, and timeframe.
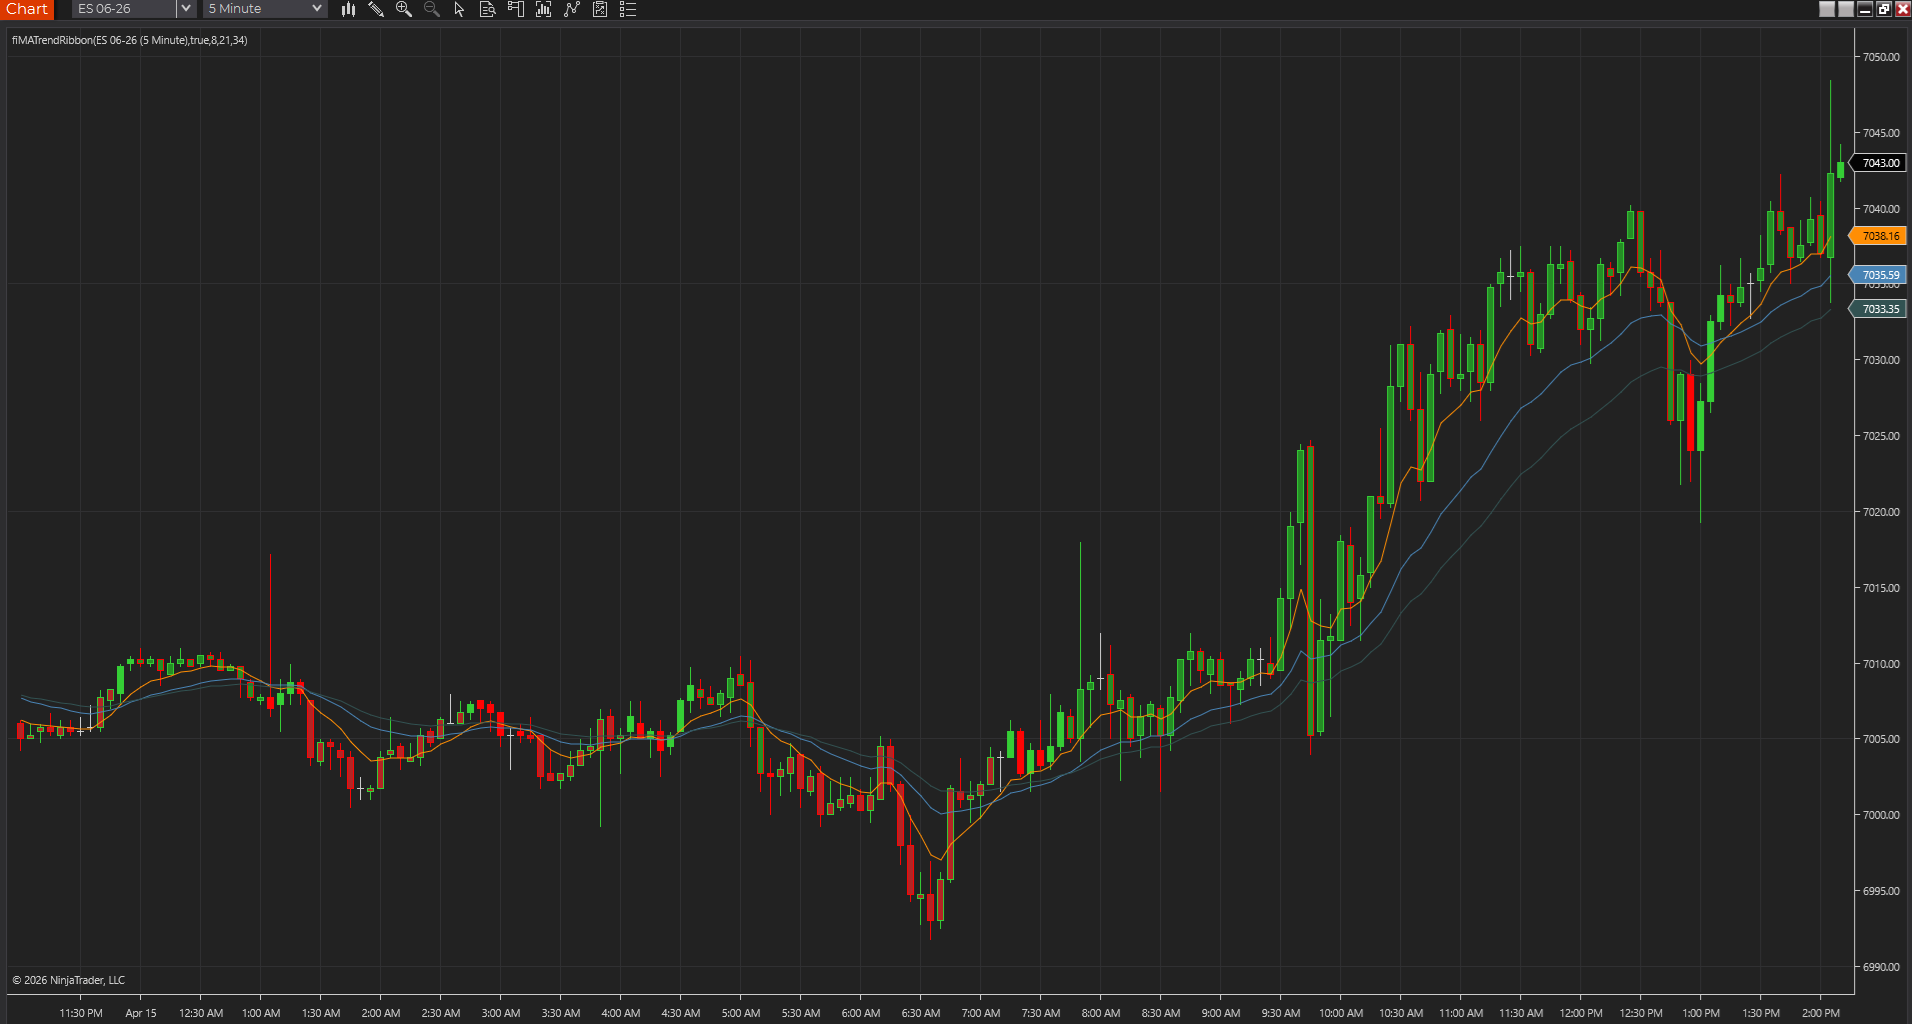
EMA ribbon alignment on chart
A chart capture showing the Moving Average Trend Ribbon keeping short-term alignment and compression visible.
Best fit
- Seeing whether short-term averages are aligned.
- Filtering trades against obvious trend direction.
- Reviewing pullbacks into a multi-EMA ribbon.
Before using it live
- Import the NinjaTrader 8 ZIP through NinjaTrader's normal import flow.
- Apply it to a clean chart first and confirm the three EMA lines are visible.
- Choose periods that match the tempo of the market you trade.
- Review how the tool behaves on your actual session template, chart type, and instrument.
Settings to review
Controls the shortest EMA in the ribbon.
Controls the middle EMA in the ribbon.
Optionally colors bars when the ribbon is fully bullish or bearish.
Installation notes
- Import the NinjaTrader 8 ZIP through NinjaTrader's normal import flow.
- Apply it to a clean chart first and confirm the three EMA lines are visible.
- Choose periods that match the tempo of the market you trade.
Downloads
Source code
These source examples are provided for copy/paste workflows on other charting platforms. Review and test any script in a simulator before using it on a live chart.
{
  Moving Average Trend Ribbon
  FreeIndicators.com source example.
  Works as a starting point for TradeStation EasyLanguage and MultiCharts PowerLanguage.
}

Inputs: FastLength(8), MediumLength(21), SlowLength(34);
Vars: FastMA(0), MediumMA(0), SlowMA(0);

FastMA = XAverage(Close, FastLength);
MediumMA = XAverage(Close, MediumLength);
SlowMA = XAverage(Close, SlowLength);

Plot1(FastMA, "Fast");
Plot2(MediumMA, "Medium");
Plot3(SlowMA, "Slow");// Moving Average Trend Ribbon
// FreeIndicators.com source example for MetaTrader 4.
#property indicator_chart_window
#property indicator_buffers 3
#property indicator_color1 DodgerBlue
#property indicator_color2 Crimson
#property indicator_color3 SeaGreen
double Buffer1[];
double Buffer2[];
double Buffer3[];
int init() {
SetIndexBuffer(0, Buffer1);
SetIndexBuffer(1, Buffer2);
SetIndexBuffer(2, Buffer3);
return(0);
}
int start() {
int counted = IndicatorCounted();
int limit = Bars - counted - 1;
int fast = 8, medium = 21, slow = 34;
for(int i = limit; i >= 0; i--) {
Buffer1[i] = iMA(NULL, 0, fast, 0, MODE_EMA, PRICE_CLOSE, i);
Buffer2[i] = iMA(NULL, 0, medium, 0, MODE_EMA, PRICE_CLOSE, i);
Buffer3[i] = iMA(NULL, 0, slow, 0, MODE_EMA, PRICE_CLOSE, i);
}
return(0);
}// Moving Average Trend Ribbon
// FreeIndicators.com source example for MetaTrader 5.
#property indicator_chart_window
#property indicator_buffers 3
#property indicator_plots 3
double Buffer1[];
double Buffer2[];
double Buffer3[];
int OnInit() {
SetIndexBuffer(0, Buffer1, INDICATOR_DATA);
SetIndexBuffer(1, Buffer2, INDICATOR_DATA);
SetIndexBuffer(2, Buffer3, INDICATOR_DATA);
return(INIT_SUCCEEDED);
}
int OnCalculate(const int rates_total,
const int prev_calculated,
const datetime &time[],
const double &open[],
const double &high[],
const double &low[],
const double &close[],
const long &tick_volume[],
const long &volume[],
const int &spread[]) {
int start = prev_calculated > 1 ? prev_calculated - 1 : 1;
int fast = 8, medium = 21, slow = 34;
for(int i = start; i < rates_total; i++) {
Buffer1[i] = iMA(_Symbol, PERIOD_CURRENT, fast, 0, MODE_EMA, PRICE_CLOSE);
Buffer2[i] = iMA(_Symbol, PERIOD_CURRENT, medium, 0, MODE_EMA, PRICE_CLOSE);
Buffer3[i] = iMA(_Symbol, PERIOD_CURRENT, slow, 0, MODE_EMA, PRICE_CLOSE);
}
return(rates_total);
}//@version=5
indicator("Moving Average Trend Ribbon", overlay=true)
fastLength = input.int(8, "Fast EMA")
mediumLength = input.int(21, "Medium EMA")
slowLength = input.int(34, "Slow EMA")
fast = ta.ema(close, fastLength)
medium = ta.ema(close, mediumLength)
slow = ta.ema(close, slowLength)
plot(fast, "Fast", color=color.orange)
plot(medium, "Medium", color=color.blue)
plot(slow, "Slow", color=color.gray)
barcolor(fast > medium and medium > slow ? color.green : fast < medium and medium < slow ? color.red : na)After the download
Keep the next step tied to this exact tool
Install it cleanly, subscribe for future updates if this workflow matters, or move straight into a structured request if the tool needs another platform or a custom version.
Install guide
Keep the workspace stable
Use the clean import flow before a promising download turns into a platform cleanup project.
Open install guideEmail follow-up
Get updates if this tool changes
Use the email signup if you want future indicator and workflow updates without checking back manually.
Join updatesCustom NT8 work
Turn this into a custom NinjaTrader build
Use Moore Tech when the free indicator needs a private modification, NT8 repair, platform port, alert upgrade, or strategy version built around your exact rules.
Paid next step
Get the Daily Trading Plan PDF after the download
Use the $29.99 PDF when you want the key levels, scenarios, and invalidation points mapped before the session instead of building the day from scratch.
Daily Trading Plan PDF - $29.99Limitations
- Moving averages lag price.
- Ribbons can flip repeatedly during sideways markets.
- Trend alignment does not define risk or profit targets.
Frequently asked questions
Does it repaint?
This tool can revise its most recent labels or levels until enough bars have formed to confirm the swing or range it is using. Older confirmed values should be more stable than the most recent developing ones.
Which platforms are covered?
NinjaTrader 8, TradeStation EasyLanguage, MultiCharts PowerLanguage, MetaTrader 4, MetaTrader 5, TradingView Pine Script are currently represented through downloads or source pages.
Is source code included?
Yes. This page includes source examples or links to platform-specific source pages where applicable.