Best places to start in this workflow
These are the quickest pages to open if you want the category to turn into something practical right away.
Featured indicator
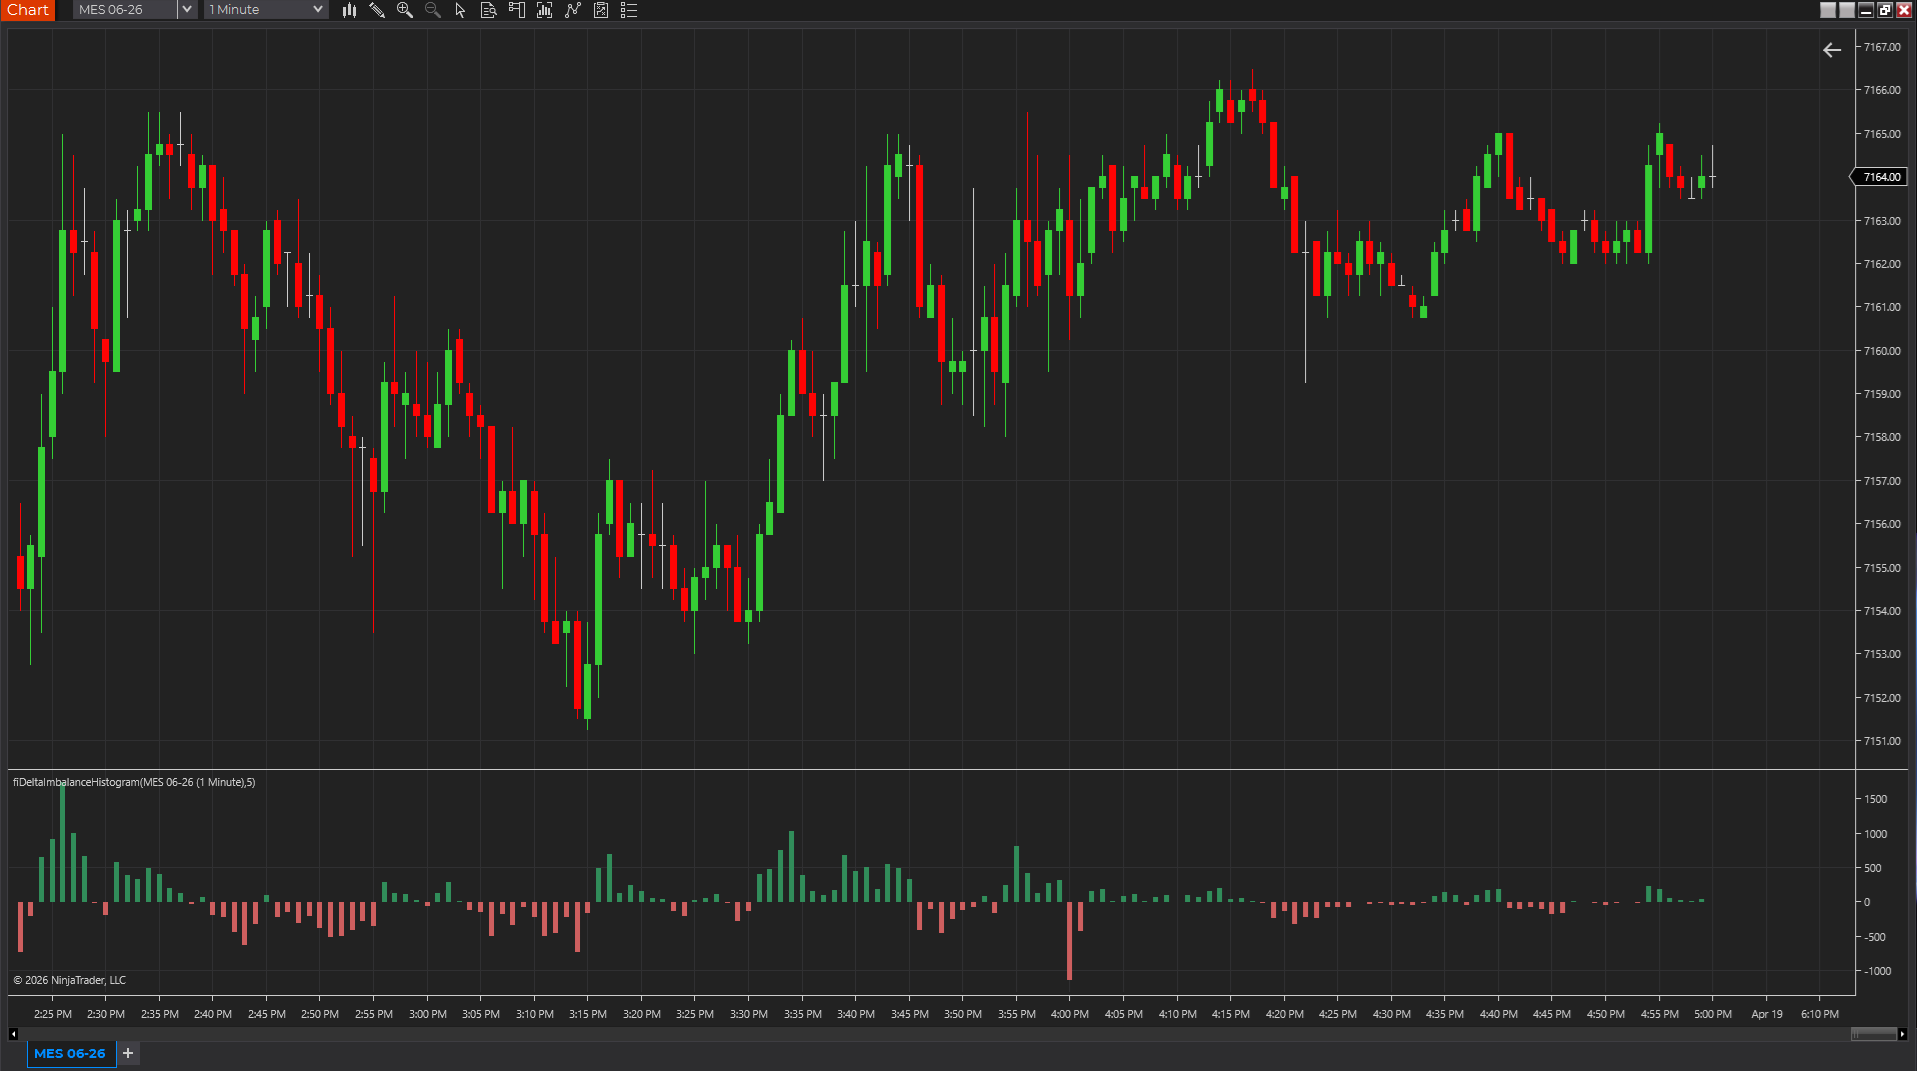
Delta Imbalance Histogram
Uses candle body, range, and volume as a lightweight pressure proxy so traders can see whether momentum is skewing positive or negative without a full footprint feed.
Open indicatorFeatured indicator
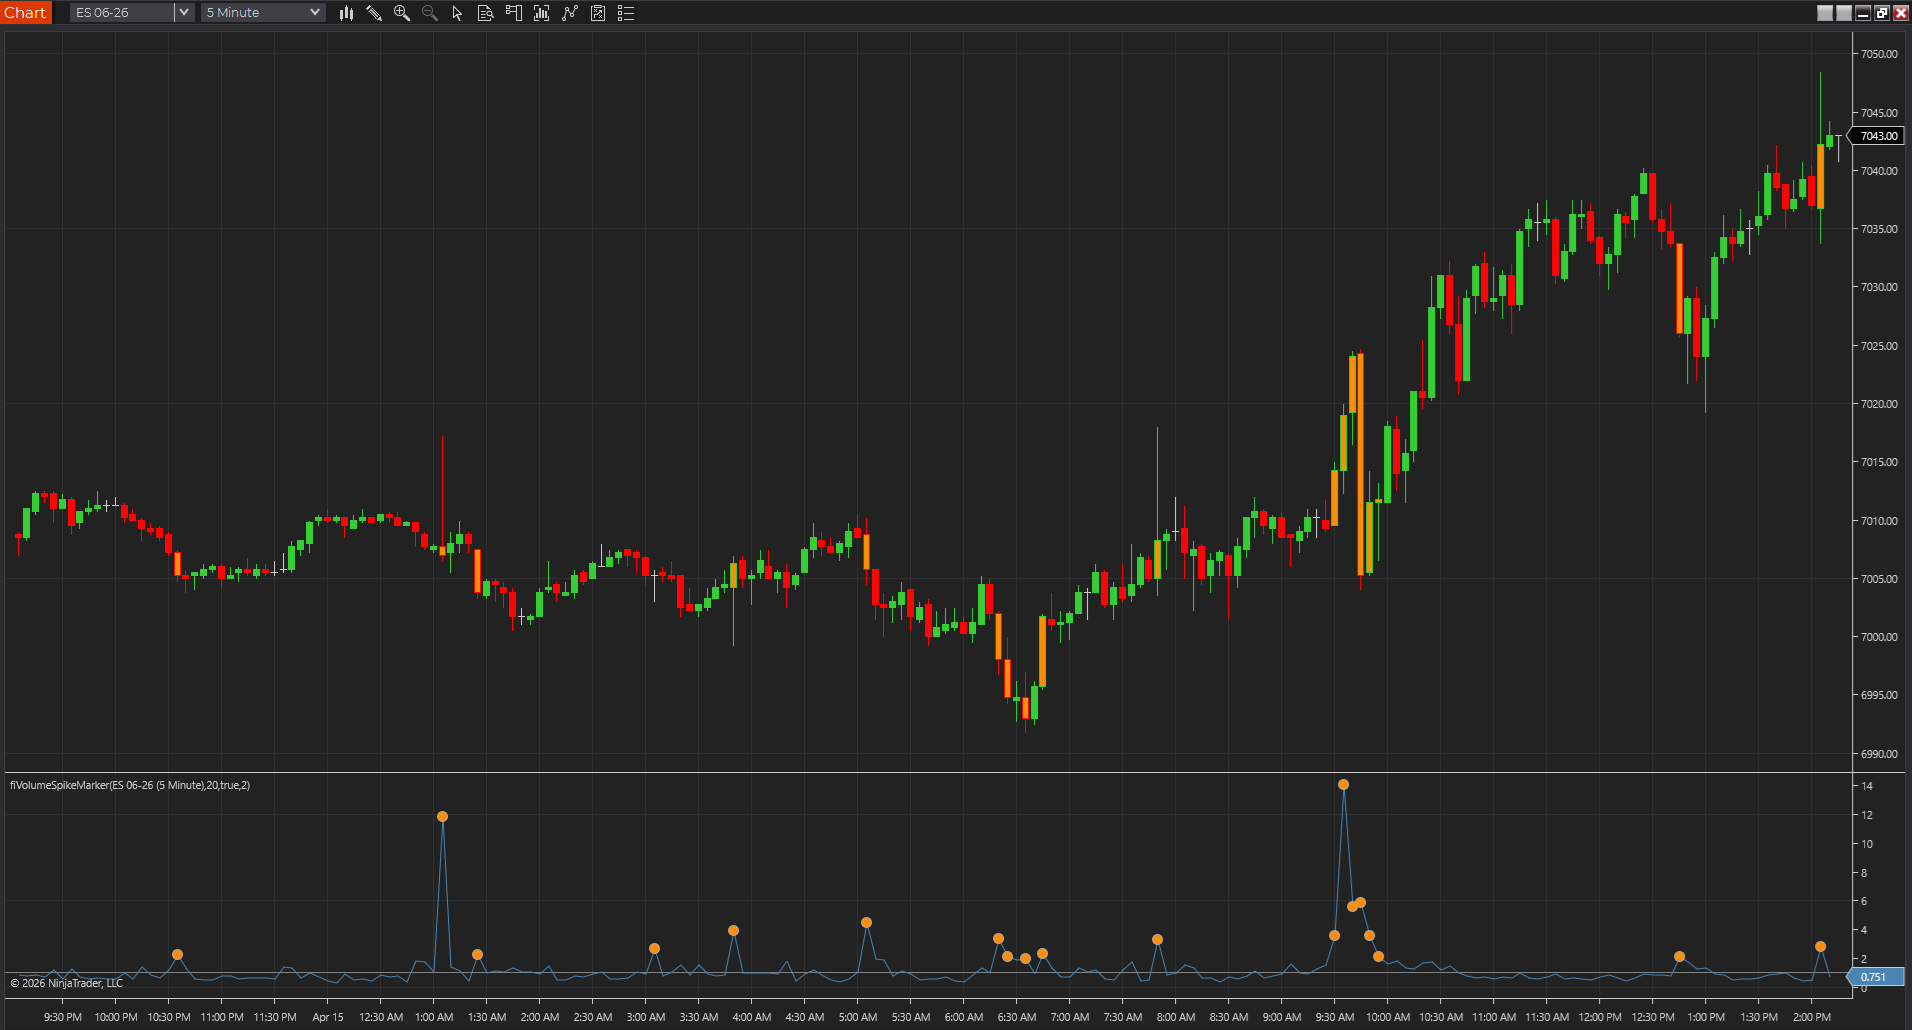
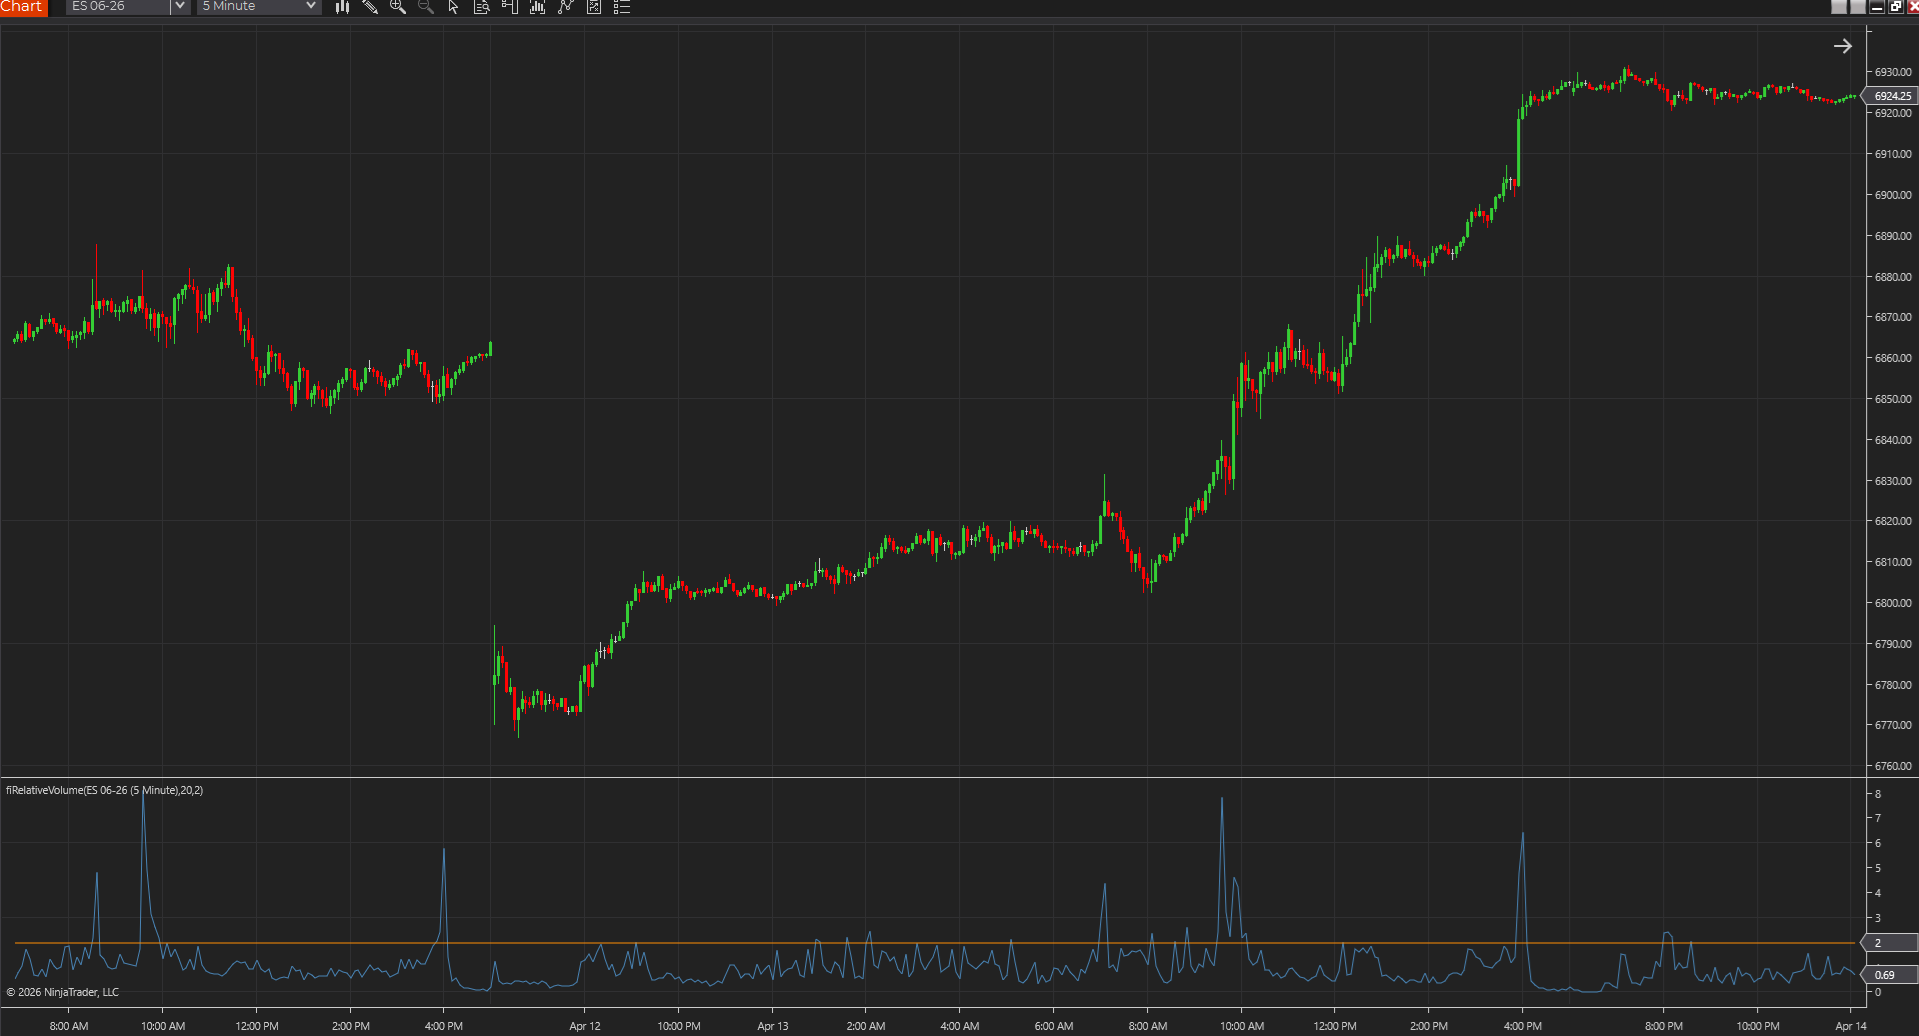
Volume Spike Marker
Compares current volume to recent average volume and highlights bars that are doing meaningfully more business than normal.
Open indicatorFeatured indicator
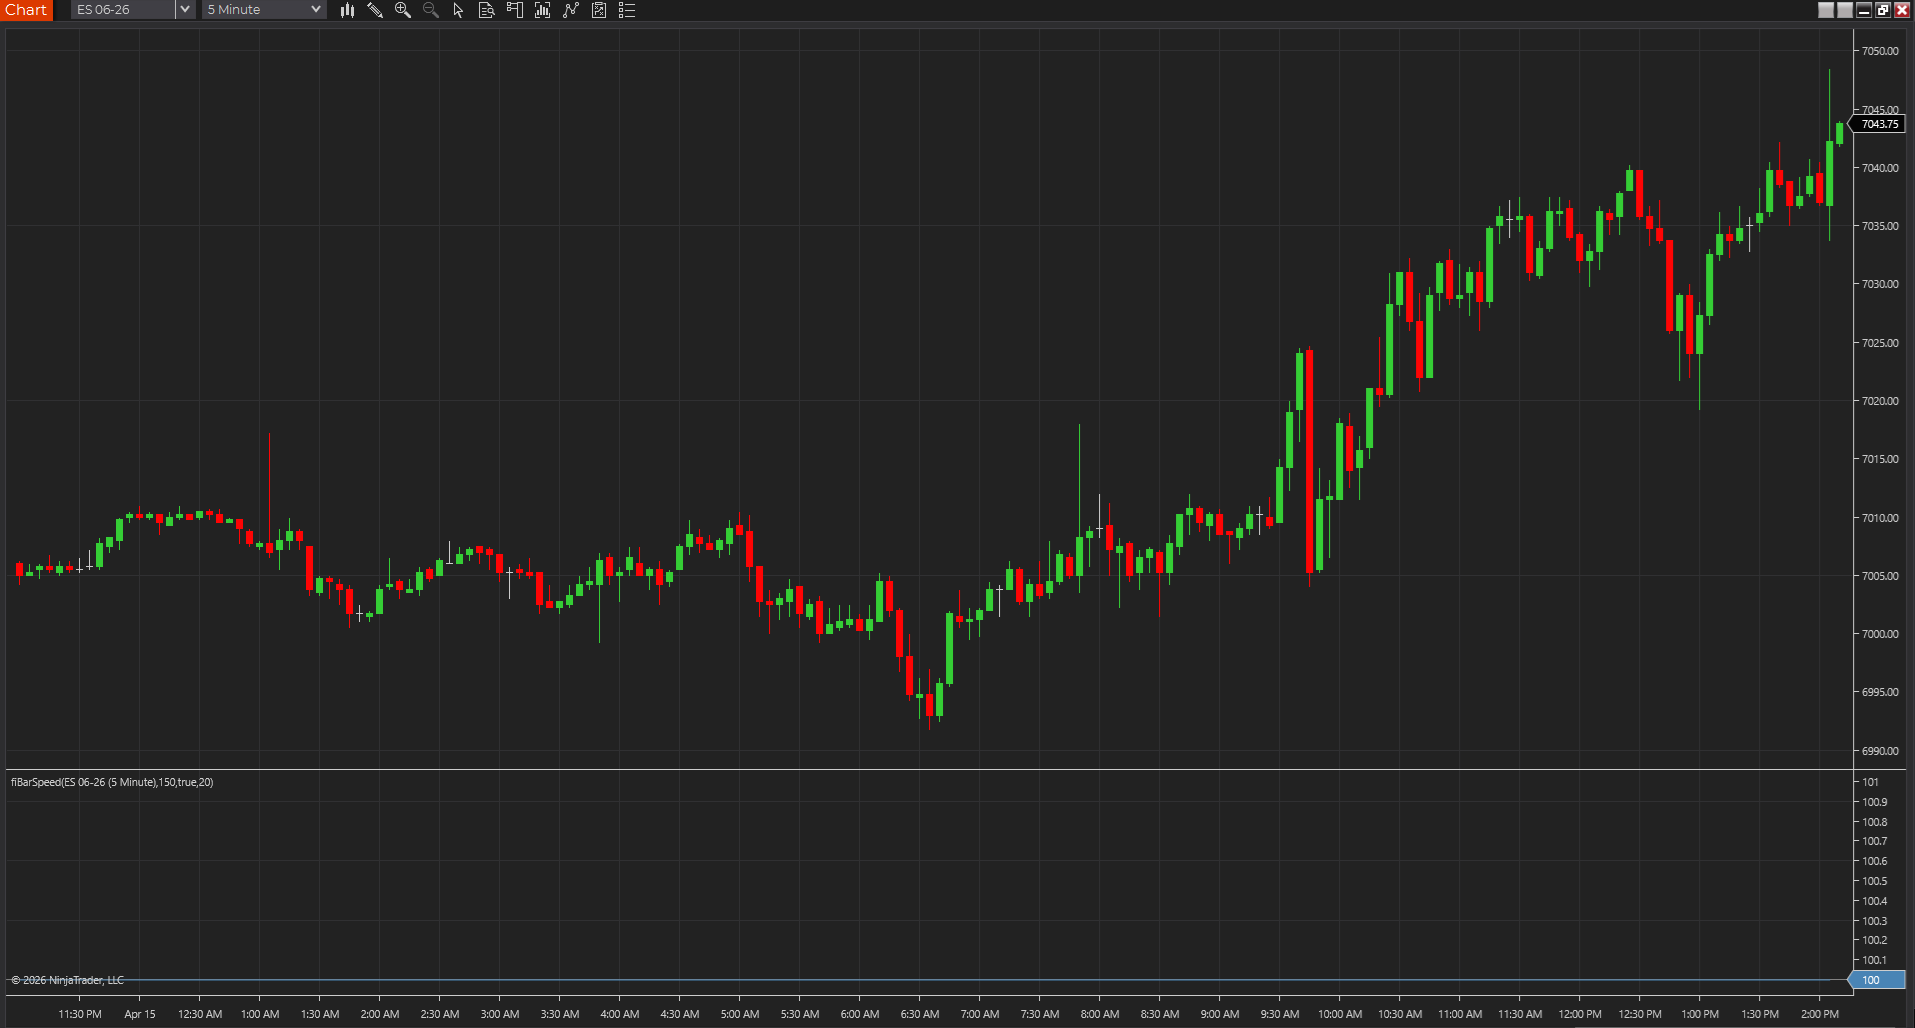
Bar Speed Indicator
Shows whether bars are printing with real urgency or just drifting, so participation shifts stand out faster across tick, range, Renko, volume, and time charts.
Open indicatorKey terms in this workflow
Use these definitions to sharpen how you read the tools grouped in this category.
Participation should answer a practical question
The best volume tools help answer a real question: is this move attracting attention, fading out, or pushing through a level with urgency? If it does not change a decision, it is probably just decoration.
Tempo matters too
Not every chart tells the story through raw volume alone. On some chart types, bar speed or completion rate tells you more, and tells you sooner.
Pair volume with location
Participation gets more interesting when it shows up at an opening-range edge, prior-session level, or channel boundary. Context is what gives the burst meaning.
What tends to work best in this category
Workflow tip
Use volume tools to answer a live chart question, not just to add another panel.
Workflow tip
Volume becomes more useful when it lines up with location or breakout structure.
Workflow tip
Tempo and urgency tools often outperform raw volume on faster intraday workflows.
Related pages worth opening next
Use these to compare tools, sharpen the workflow, or jump into a more specific implementation path.
Related page
Volume Spike vs Bar Speed Indicator
Open a deeper comparison or platform-specific page connected to this category.
Open pageRelated page
Volume spike guide
Open a deeper comparison or platform-specific page connected to this category.
Open pageRelated page
Trading costs calculator
Open a deeper comparison or platform-specific page connected to this category.
Open pageKeep browsing without losing the thread
These jumps keep you inside the same research flow instead of sending you back to a generic starting point.
Next step
All categories
Compare the other workflow hubs in the library.
Keep goingNext step
All indicators
Browse every indicator page from one searchable index.
Keep goingNext step
Guides
Open comparison guides, install help, and setup walkthroughs.
Keep goingQuestions traders usually have here
What is the difference between a volume spike tool and a bar speed tool?
A volume spike tool focuses on participation size, while a bar speed tool focuses on how quickly price is moving. They often complement each other, but they do not answer the exact same question.
What should volume indicators be paired with?
They pair best with session levels, opening range structure, VWAP, or other location tools. Participation means more when you know where it is happening.
Are volume indicators enough to build a workflow on their own?
Usually not. They work best as confirmation and context, not as the only reason to act.