What it does
RSI Divergence Marker compares confirmed swing highs and lows against RSI values to flag simple regular divergence. It is useful for traders who want exhaustion context around old highs, lows, and trend extensions without hand-marking every swing.
Who this is for
This page is aimed at traders who already know what problem RSI Divergence Marker is solving and want clearer notes on setup, tradeoffs, and platform coverage.
Key terms for this tool
Review the core trading and platform terms tied to this page before changing settings or using the study in a live workspace.
What it is not
RSI Divergence Marker is a chart-context tool. It does not place trades, manage risk automatically, or promise that a specific pattern will resolve in one direction. Use it to organize decisions, not to outsource them.
Chart examples
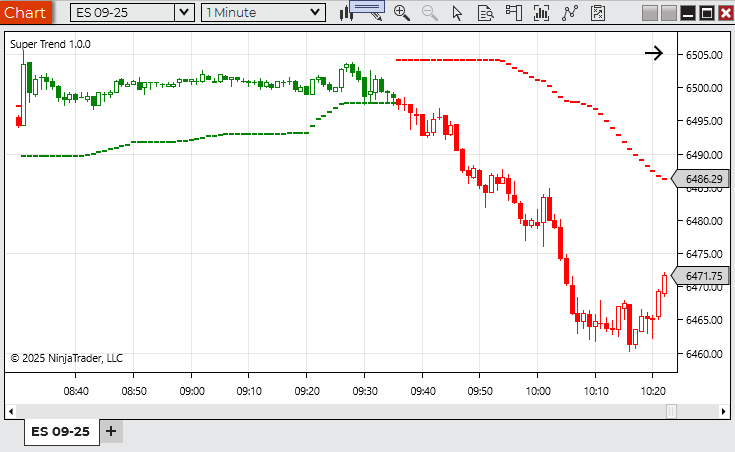
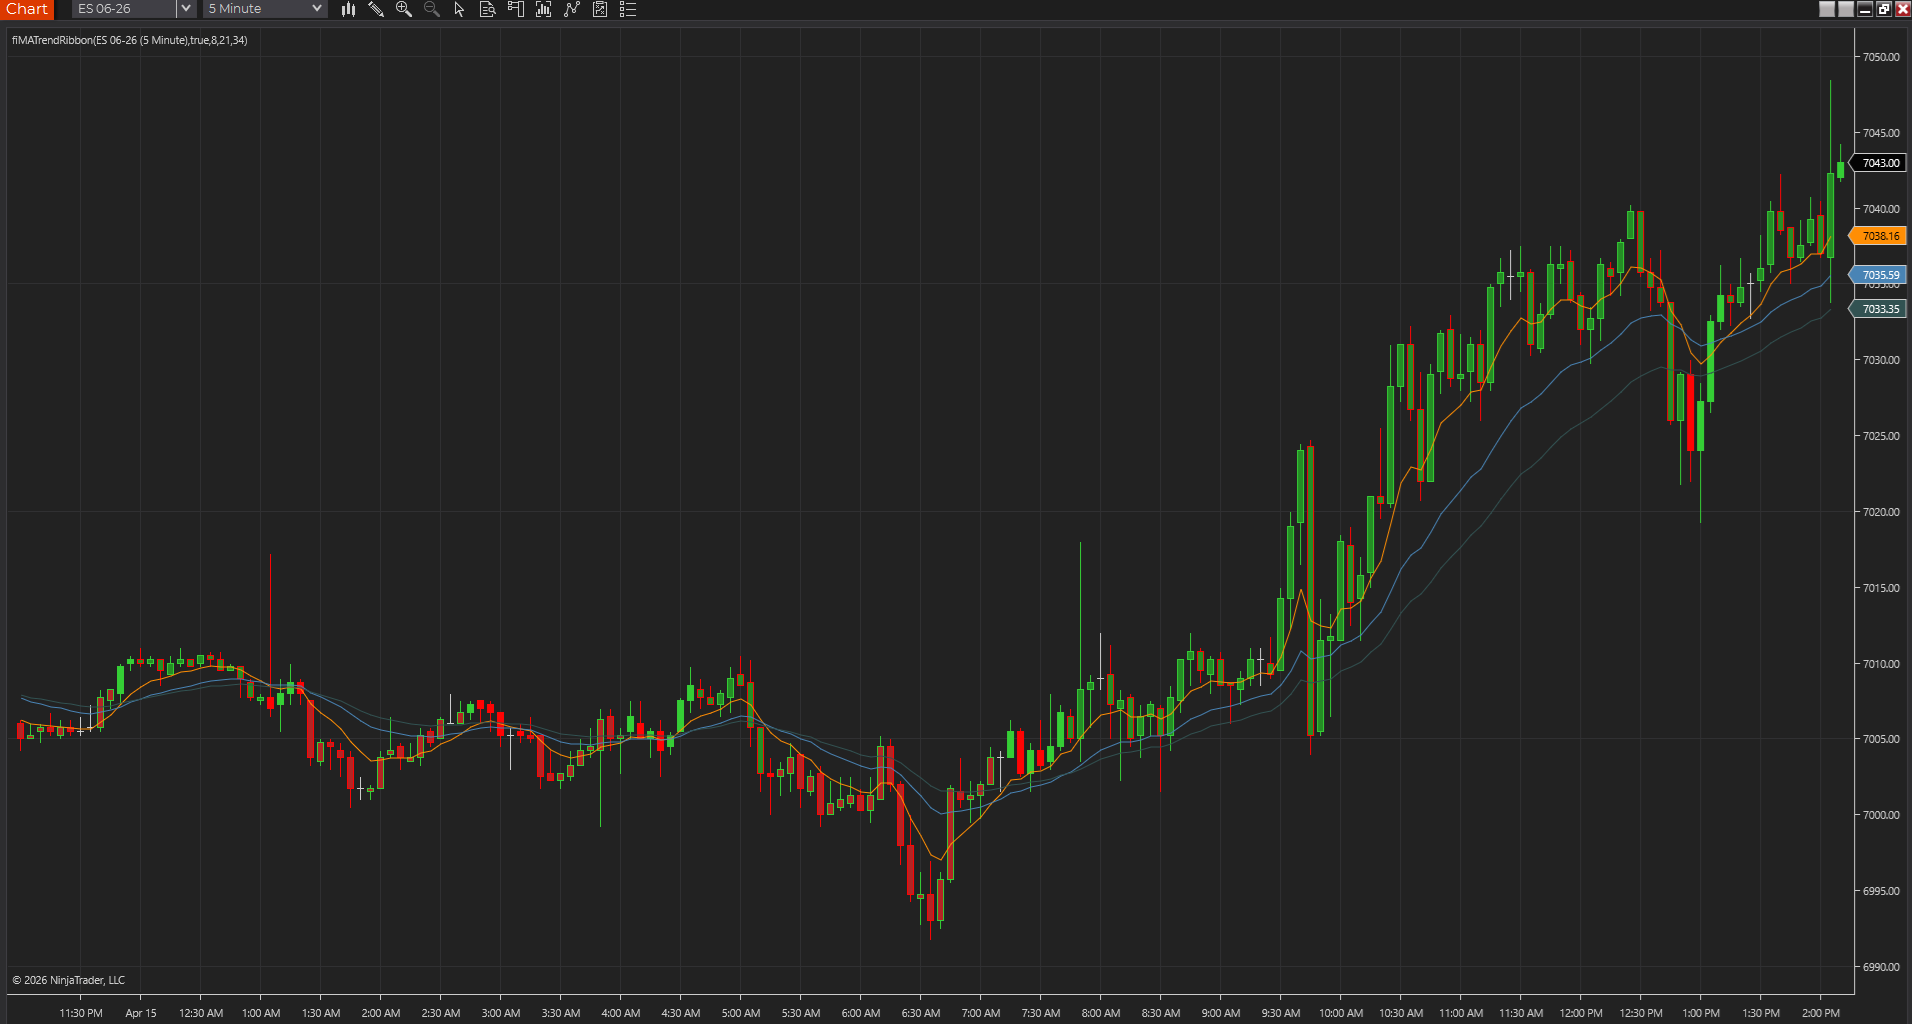
This chart capture shows the study on a real NinjaTrader workspace. Use it as visual reference, then confirm behavior on your own instrument, session, and timeframe.
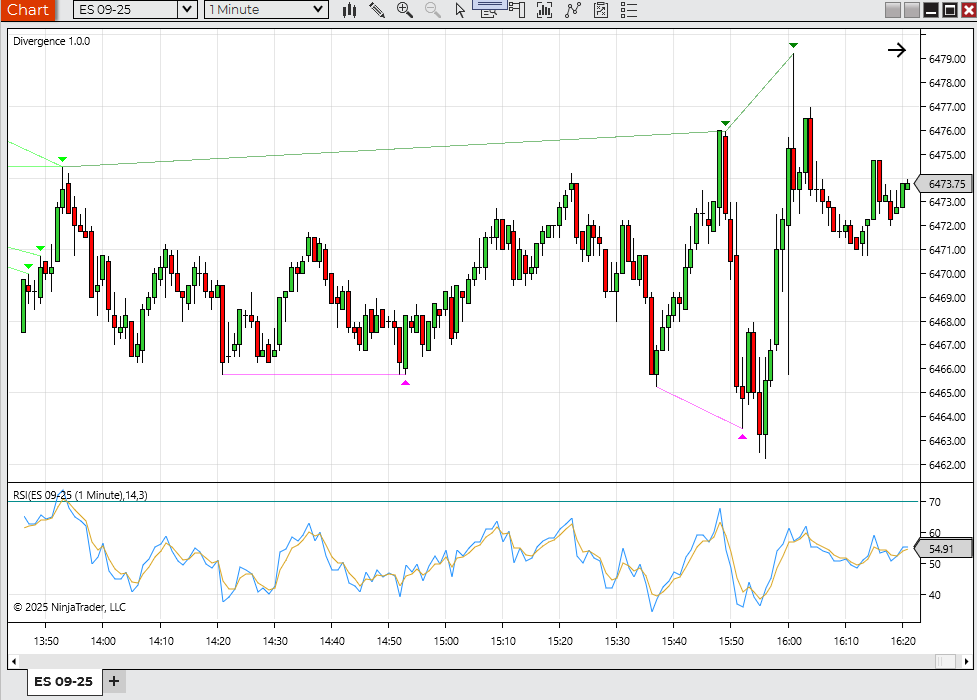
RSI divergence on chart
A chart showing RSI Divergence Marker calling out regular divergence around confirmed swing highs and lows.
Best fit
- Spotting possible exhaustion when price pushes beyond a prior swing.
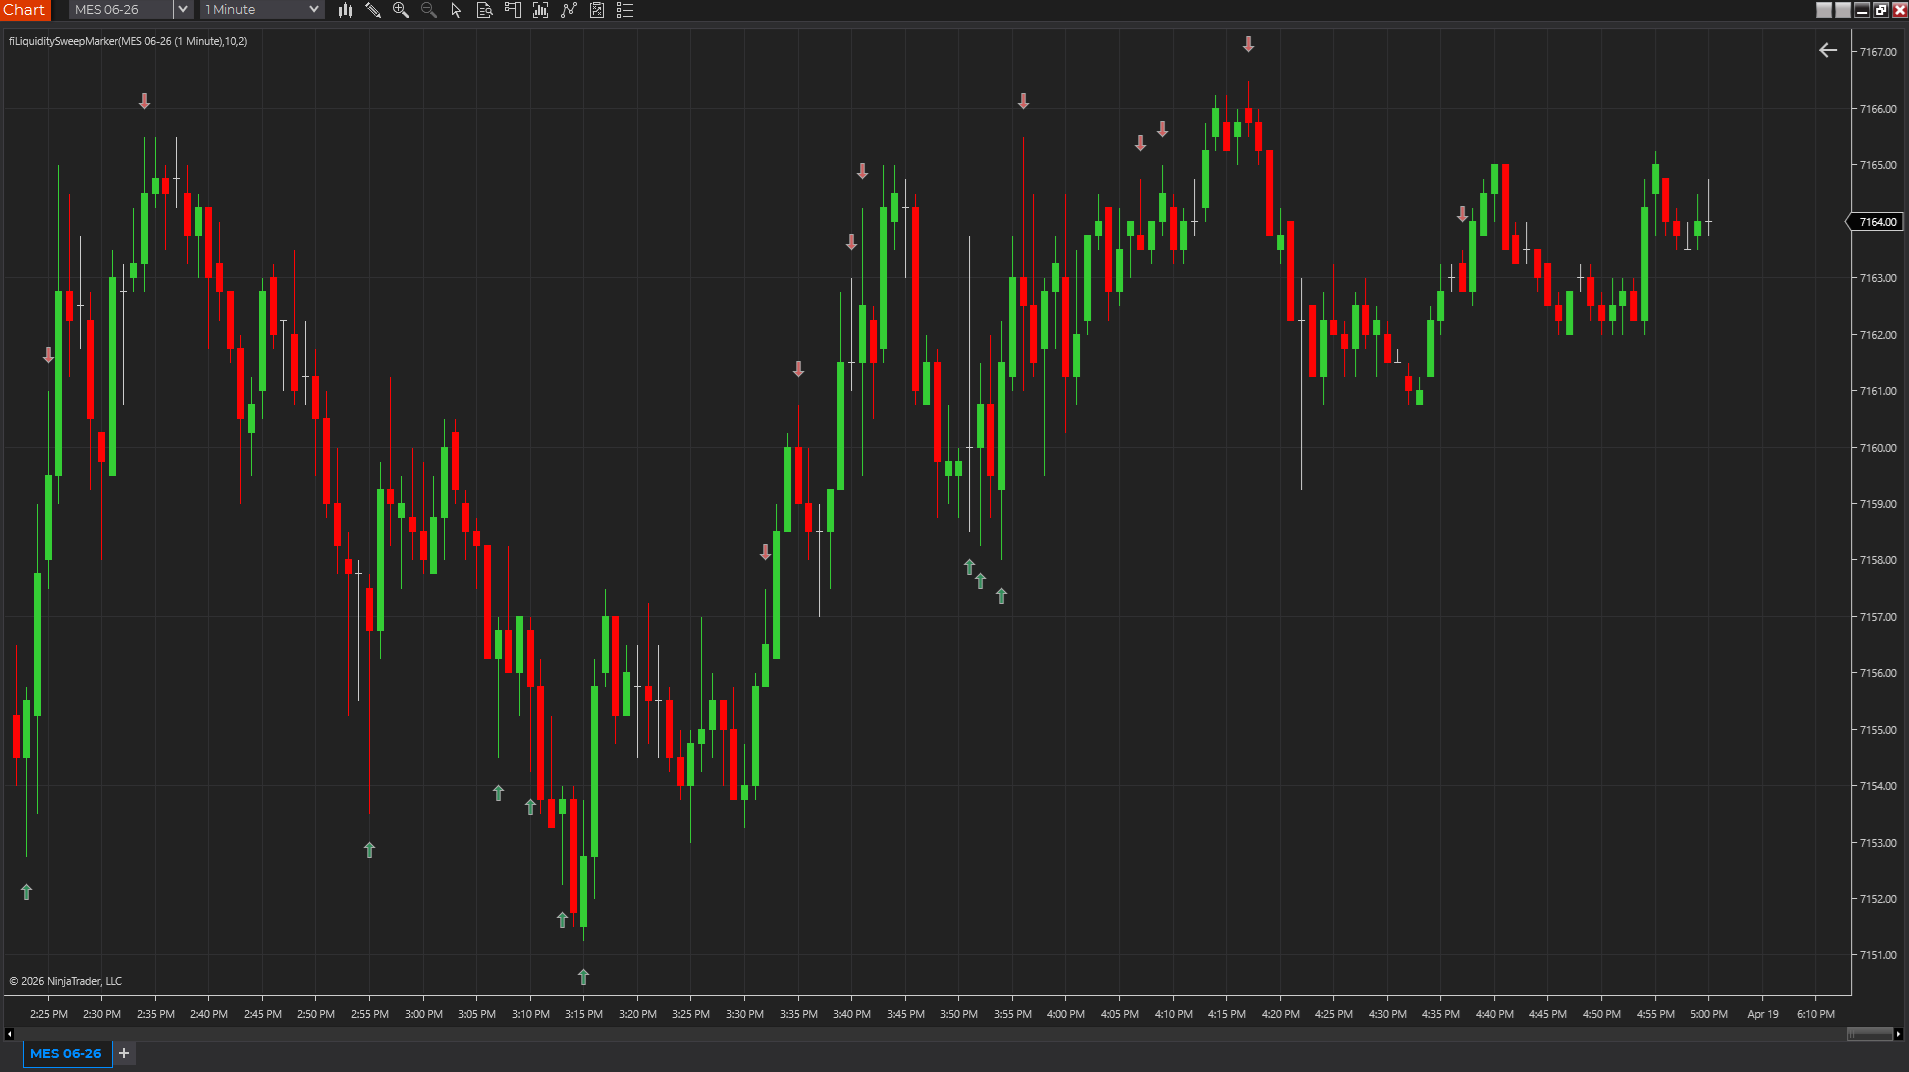
- Adding momentum context around failed breakouts and liquidity sweeps.
- Reviewing whether reversal ideas are supported or contradicted by oscillator behavior.
Before using it live
- Import the NinjaTrader 8 ZIP through NinjaTrader's normal import flow.
- Use a higher swing strength on noisy charts so divergence markers are based on meaningful pivots.
- Confirm divergence with price structure because RSI divergence can appear early in strong trends.
- Review how the tool behaves on your actual session template, chart type, and instrument.
Settings to review
Controls the RSI lookback used for divergence comparison.
Controls the smoothing value passed to NinjaTrader's RSI study.
Controls how many bars on each side are required to confirm a swing.
Requires RSI to diverge by at least this amount before a marker appears.
Moves arrows farther away from price for readability.
Installation notes
- Import the NinjaTrader 8 ZIP through NinjaTrader's normal import flow.
- Use a higher swing strength on noisy charts so divergence markers are based on meaningful pivots.
- Confirm divergence with price structure because RSI divergence can appear early in strong trends.
Downloads
Source code
These source examples are provided for copy/paste workflows on other charting platforms. Review and test any script in a simulator before using it on a live chart.
{
  RSI Divergence Marker
  FreeIndicators.com source example.
  Works as a starting point for TradeStation EasyLanguage and MultiCharts PowerLanguage.
}

Inputs: RSILength(14), Strength(5), MinDiff(2);
Vars: R(0), SwingLow(false), SwingHigh(false), PrevLow(0), PrevLowRsi(0), PrevHigh(0), PrevHighRsi(0);

R = RSI(Close, RSILength);
SwingLow = Low[Strength] = Lowest(Low, Strength * 2 + 1);
SwingHigh = High[Strength] = Highest(High, Strength * 2 + 1);

If SwingLow And PrevLow <> 0 And Low[Strength] < PrevLow And R[Strength] > PrevLowRsi + MinDiff Then Plot1(Low[Strength], "BullDiv");
If SwingHigh And PrevHigh <> 0 And High[Strength] > PrevHigh And R[Strength] < PrevHighRsi - MinDiff Then Plot2(High[Strength], "BearDiv");

If SwingLow Then Begin PrevLow = Low[Strength]; PrevLowRsi = R[Strength]; End;
If SwingHigh Then Begin PrevHigh = High[Strength]; PrevHighRsi = R[Strength]; End;// RSI Divergence Marker
// FreeIndicators.com source example for MetaTrader 4.
#property indicator_chart_window
#property indicator_buffers 3
#property indicator_color1 DodgerBlue
#property indicator_color2 Crimson
#property indicator_color3 SeaGreen
double Buffer1[];
double Buffer2[];
double Buffer3[];
int init() {
SetIndexBuffer(0, Buffer1);
SetIndexBuffer(1, Buffer2);
SetIndexBuffer(2, Buffer3);
return(0);
}
int start() {
int counted = IndicatorCounted();
int limit = Bars - counted - 1;
int rsiPeriod = 14;
for(int i = limit; i >= 10; i--) {
double r = iRSI(NULL, 0, rsiPeriod, PRICE_CLOSE, i);
Buffer1[i] = r < 35 ? Low[i] : EMPTY_VALUE;
Buffer2[i] = r > 65 ? High[i] : EMPTY_VALUE;
}
return(0);
}// RSI Divergence Marker
// FreeIndicators.com source example for MetaTrader 5.
#property indicator_chart_window
#property indicator_buffers 3
#property indicator_plots 3
double Buffer1[];
double Buffer2[];
double Buffer3[];
int OnInit() {
SetIndexBuffer(0, Buffer1, INDICATOR_DATA);
SetIndexBuffer(1, Buffer2, INDICATOR_DATA);
SetIndexBuffer(2, Buffer3, INDICATOR_DATA);
return(INIT_SUCCEEDED);
}
int OnCalculate(const int rates_total,
const int prev_calculated,
const datetime &time[],
const double &open[],
const double &high[],
const double &low[],
const double &close[],
const long &tick_volume[],
const long &volume[],
const int &spread[]) {
int start = prev_calculated > 1 ? prev_calculated - 1 : 1;
for(int i = MathMax(start, 10); i < rates_total; i++) {
double body = MathAbs(close[i] - open[i]);
bool possibleBull = close[i] > open[i] && low[i] < low[i - 1] && body > 0;
bool possibleBear = close[i] < open[i] && high[i] > high[i - 1] && body > 0;
Buffer1[i] = possibleBull ? low[i] : EMPTY_VALUE;
Buffer2[i] = possibleBear ? high[i] : EMPTY_VALUE;
}
return(rates_total);
}//@version=5
indicator("RSI Divergence Marker", overlay=true)
rsiLength = input.int(14, "RSI period", minval=2)
strength = input.int(5, "Swing strength", minval=2)
minDiff = input.float(2.0, "Minimum RSI difference", minval=0.1)
r = ta.rsi(close, rsiLength)
pivotLow = ta.pivotlow(low, strength, strength)
pivotHigh = ta.pivothigh(high, strength, strength)
var float prevLow = na
var float prevLowRsi = na
var float prevHigh = na
var float prevHighRsi = na
bullDiv = not na(pivotLow) and not na(prevLow) and pivotLow < prevLow and r[strength] > prevLowRsi + minDiff
bearDiv = not na(pivotHigh) and not na(prevHigh) and pivotHigh > prevHigh and r[strength] < prevHighRsi - minDiff
if not na(pivotLow)
prevLow := pivotLow
prevLowRsi := r[strength]
if not na(pivotHigh)
prevHigh := pivotHigh
prevHighRsi := r[strength]
plotshape(bullDiv, "Bullish RSI divergence", shape.triangleup, location.belowbar, color=color.green, offset=-strength)
plotshape(bearDiv, "Bearish RSI divergence", shape.triangledown, location.abovebar, color=color.red, offset=-strength)After the download
Keep the next step tied to this exact tool
Install it cleanly, subscribe for future updates if this workflow matters, or move straight into a structured request if the tool needs another platform or a custom version.
Install guide
Keep the workspace stable
Use the clean import flow before a promising download turns into a platform cleanup project.
Open install guideEmail follow-up
Get updates if this tool changes
Use the email signup if you want future indicator and workflow updates without checking back manually.
Join updatesCustom NT8 work
Turn this into a custom NinjaTrader build
Use Moore Tech when the free indicator needs a private modification, NT8 repair, platform port, alert upgrade, or strategy version built around your exact rules.
Paid next step
Get the Daily Trading Plan PDF after the download
Use the $29.99 PDF when you want the key levels, scenarios, and invalidation points mapped before the session instead of building the day from scratch.
Daily Trading Plan PDF - $29.99Limitations
- Divergence can persist for many bars before price reacts.
- Confirmed swing logic means markers appear after the pivot is known.
- This tool marks regular divergence only, not a full oscillator strategy.
Frequently asked questions
Does it repaint?
This tool can revise its most recent labels or levels until enough bars have formed to confirm the swing or range it is using. Older confirmed values should be more stable than the most recent developing ones.
Which platforms are covered?
NinjaTrader 8, TradeStation EasyLanguage, MultiCharts PowerLanguage, MetaTrader 4, MetaTrader 5, TradingView Pine Script are currently represented through downloads or source pages.
Is source code included?
Yes. This page includes source examples or links to platform-specific source pages where applicable.