What it does
Exponential VWAP puts more weight on recent volume than older session activity, so the line responds faster when intraday conditions change. It works best as a quicker fair-value reference alongside price structure or participation tools.
Who this is for
This page is aimed at traders who already know what problem Exponential VWAP is solving and want clearer notes on setup, tradeoffs, and platform coverage.
Key terms for this tool
Review the core trading and platform terms tied to this page before changing settings or using the study in a live workspace.
What it is not
Exponential VWAP is a chart-context tool. It does not place trades, manage risk automatically, or promise that a specific pattern will resolve in one direction. Use it to organize decisions, not to outsource them.
Chart examples
This chart capture shows the study on a real NinjaTrader workspace. Use it as visual reference, then confirm behavior on your own instrument, session, and timeframe.
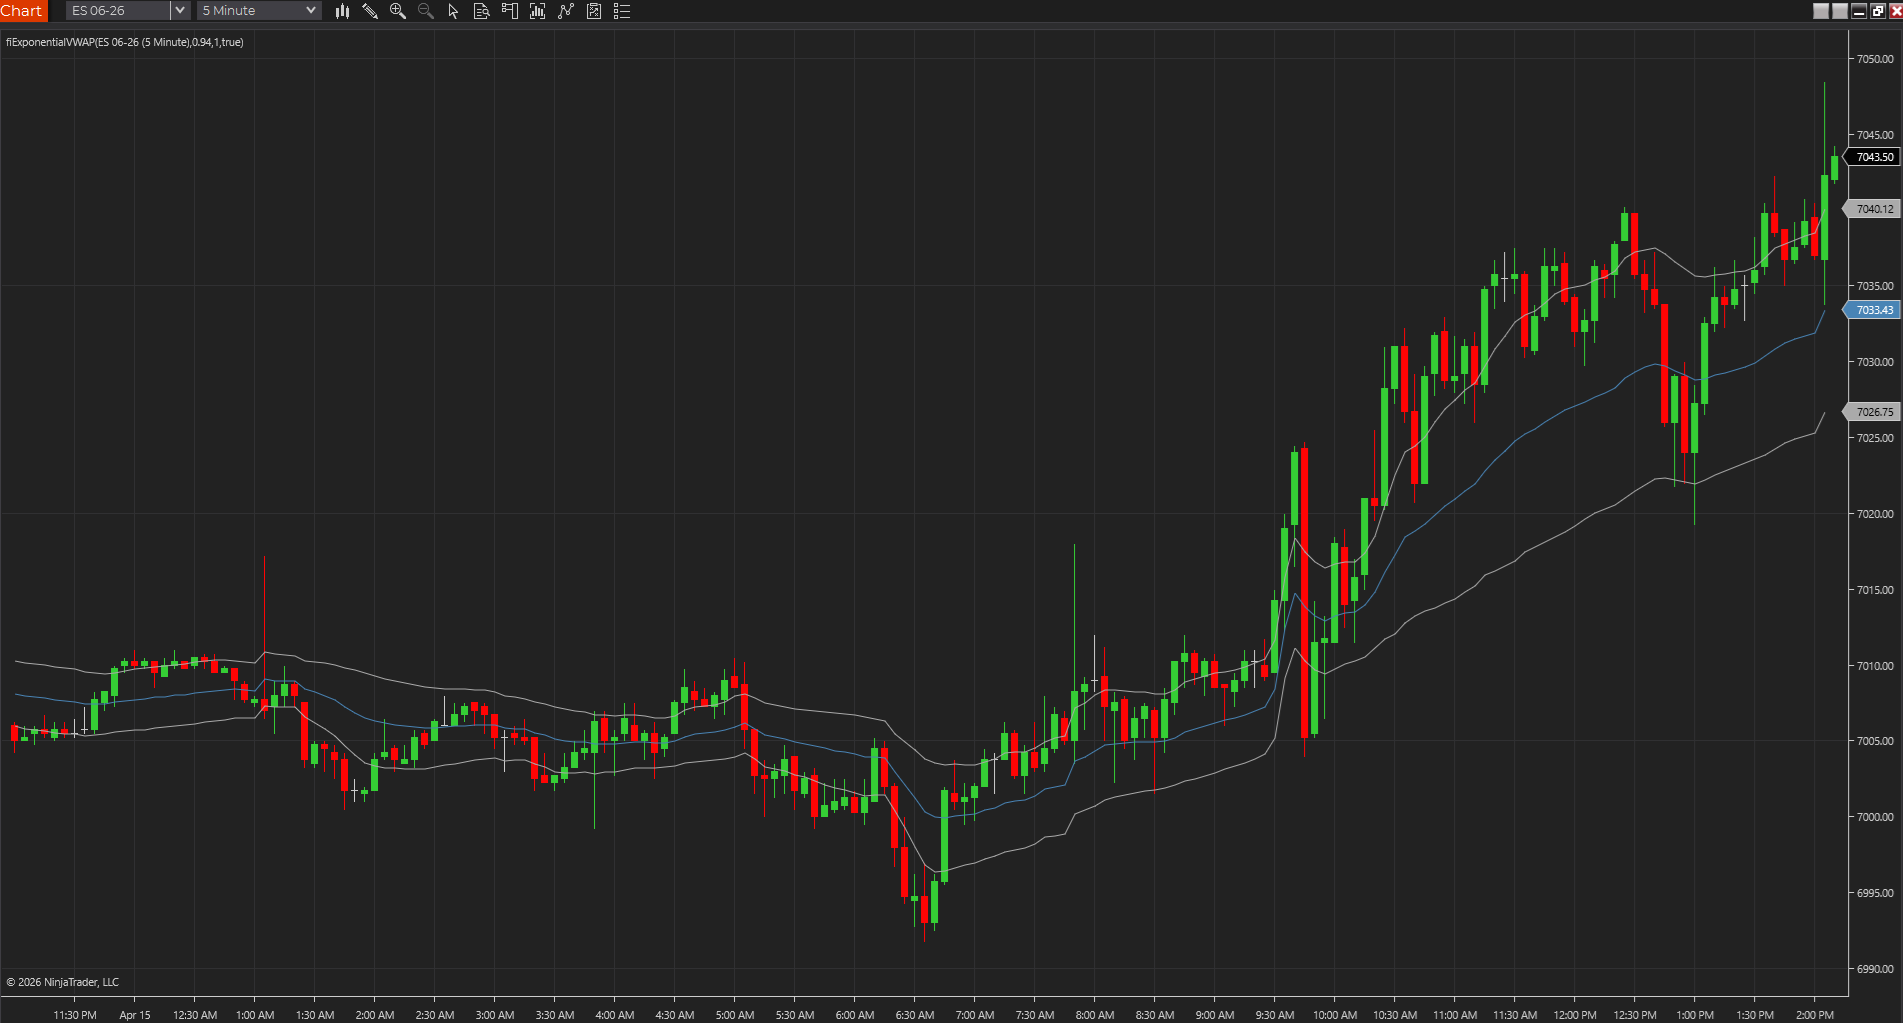
Faster VWAP context on chart
A chart capture showing Exponential VWAP as a faster fair-value reference during intraday movement.
Best fit
- Tracking dynamic fair value during high-volume sessions.
- Comparing trend continuation against a volume-weighted baseline.
- Studying pullbacks into fast VWAP context.
Before using it live
- Import the NinjaTrader 8 ZIP through NinjaTrader's normal import flow.
- Use it on intraday charts with reliable volume data.
- Compare against regular session VWAP before trading with it.
- Review how the tool behaves on your actual session template, chart type, and instrument.
Settings to review
Adjusts how heavily recent volume influences the line.
Toggles the upper and lower deviation bands.
Controls band distance from the EVWAP line.
Installation notes
- Import the NinjaTrader 8 ZIP through NinjaTrader's normal import flow.
- Use it on intraday charts with reliable volume data.
- Compare against regular session VWAP before trading with it.
Downloads
Source code
These source examples are provided for copy/paste workflows on other charting platforms. Review and test any script in a simulator before using it on a live chart.
{
  Exponential VWAP
  FreeIndicators.com source example.
  Works as a starting point for TradeStation EasyLanguage and MultiCharts PowerLanguage.
}

Inputs: Decay(0.94);
Vars: EWPriceVolume(0), EWVolume(0), EVWAP(0);

If Date <> Date[1] Then Begin
  EWPriceVolume = TypicalPrice * Volume;
  EWVolume = Volume;
End Else Begin
  EWPriceVolume = EWPriceVolume * Decay + TypicalPrice * Volume;
  EWVolume = EWVolume * Decay + Volume;
End;

If EWVolume > 0 Then EVWAP = EWPriceVolume / EWVolume;
Plot1(EVWAP, "EVWAP");// Exponential VWAP
// FreeIndicators.com source example for MetaTrader 4.
#property indicator_chart_window
#property indicator_buffers 3
#property indicator_color1 DodgerBlue
#property indicator_color2 Crimson
#property indicator_color3 SeaGreen
double Buffer1[];
double Buffer2[];
double Buffer3[];
int init() {
SetIndexBuffer(0, Buffer1);
SetIndexBuffer(1, Buffer2);
SetIndexBuffer(2, Buffer3);
return(0);
}
int start() {
int counted = IndicatorCounted();
int limit = Bars - counted - 1;
double decay = 0.94;
double ewPV = 0, ewV = 0;
for(int i = limit; i >= 0; i--) {
double price = (High[i] + Low[i] + Close[i]) / 3.0;
ewPV = ewPV * decay + price * Volume[i];
ewV = ewV * decay + Volume[i];
Buffer1[i] = ewV > 0 ? ewPV / ewV : price;
}
return(0);
}// Exponential VWAP
// FreeIndicators.com source example for MetaTrader 5.
#property indicator_chart_window
#property indicator_buffers 3
#property indicator_plots 3
double Buffer1[];
double Buffer2[];
double Buffer3[];
int OnInit() {
SetIndexBuffer(0, Buffer1, INDICATOR_DATA);
SetIndexBuffer(1, Buffer2, INDICATOR_DATA);
SetIndexBuffer(2, Buffer3, INDICATOR_DATA);
return(INIT_SUCCEEDED);
}
int OnCalculate(const int rates_total,
const int prev_calculated,
const datetime &time[],
const double &open[],
const double &high[],
const double &low[],
const double &close[],
const long &tick_volume[],
const long &volume[],
const int &spread[]) {
int start = prev_calculated > 1 ? prev_calculated - 1 : 1;
double decay = 0.94;
double ewPV = 0, ewV = 0;
for(int i = start; i < rates_total; i++) {
double price = (high[i] + low[i] + close[i]) / 3.0;
ewPV = ewPV * decay + price * tick_volume[i];
ewV = ewV * decay + tick_volume[i];
Buffer1[i] = ewV > 0 ? ewPV / ewV : price;
}
return(rates_total);
}//@version=5
indicator("Exponential VWAP", overlay=true)
decay = input.float(0.94, "Decay", minval=0.50, maxval=0.99)
typical = hlc3
var float ewPV = na
var float ewV = na
newSession = ta.change(time("D"))
ewPV := newSession ? typical * volume : nz(ewPV[1]) * decay + typical * volume
ewV := newSession ? volume : nz(ewV[1]) * decay + volume
evwap = ewV > 0 ? ewPV / ewV : typical
plot(evwap, "EVWAP", color=color.blue)After the download
Keep the next step tied to this exact tool
Install it cleanly, subscribe for future updates if this workflow matters, or move straight into a structured request if the tool needs another platform or a custom version.
Install guide
Keep the workspace stable
Use the clean import flow before a promising download turns into a platform cleanup project.
Open install guideEmail follow-up
Get updates if this tool changes
Use the email signup if you want future indicator and workflow updates without checking back manually.
Join updatesCustom NT8 work
Turn this into a custom NinjaTrader build
Use Moore Tech when the free indicator needs a private modification, NT8 repair, platform port, alert upgrade, or strategy version built around your exact rules.
Paid next step
Get the Daily Trading Plan PDF after the download
Use the $29.99 PDF when you want the key levels, scenarios, and invalidation points mapped before the session instead of building the day from scratch.
Daily Trading Plan PDF - $29.99Limitations
- Requires reliable volume data.
- The faster line can create more false context shifts.
- Session reset rules matter.
Frequently asked questions
Does it repaint?
This indicator is designed as a chart reference tool, not as a hindsight-only backfitted signal. Even so, you should still test it bar by bar on your chart type to confirm how it behaves on the active bar.
Which platforms are covered?
NinjaTrader 8, TradeStation EasyLanguage, MultiCharts PowerLanguage, MetaTrader 4, MetaTrader 5, TradingView Pine Script are currently represented through downloads or source pages.
Is source code included?
Yes. This page includes source examples or links to platform-specific source pages where applicable.