What it does
Classic Pivot Levels gives traders a clean prior-session pivot framework with optional R2 and S2 lines. It is designed for traders who still use pivot-based context as a fast support-and-resistance map.
Who this is for
This page is a good fit for traders who want a readable Classic Pivot Levels workflow without having to reverse-engineer the setup from forum posts or screenshots.
Key terms for this tool
Review the core trading and platform terms tied to this page before changing settings or using the study in a live workspace.
What it is not
Classic Pivot Levels is a chart-context tool. It does not place trades, manage risk automatically, or promise that a specific pattern will resolve in one direction. Use it to organize decisions, not to outsource them.
Chart examples
This chart capture shows the study on a real NinjaTrader workspace. Use it as visual reference, then confirm behavior on your own instrument, session, and timeframe.
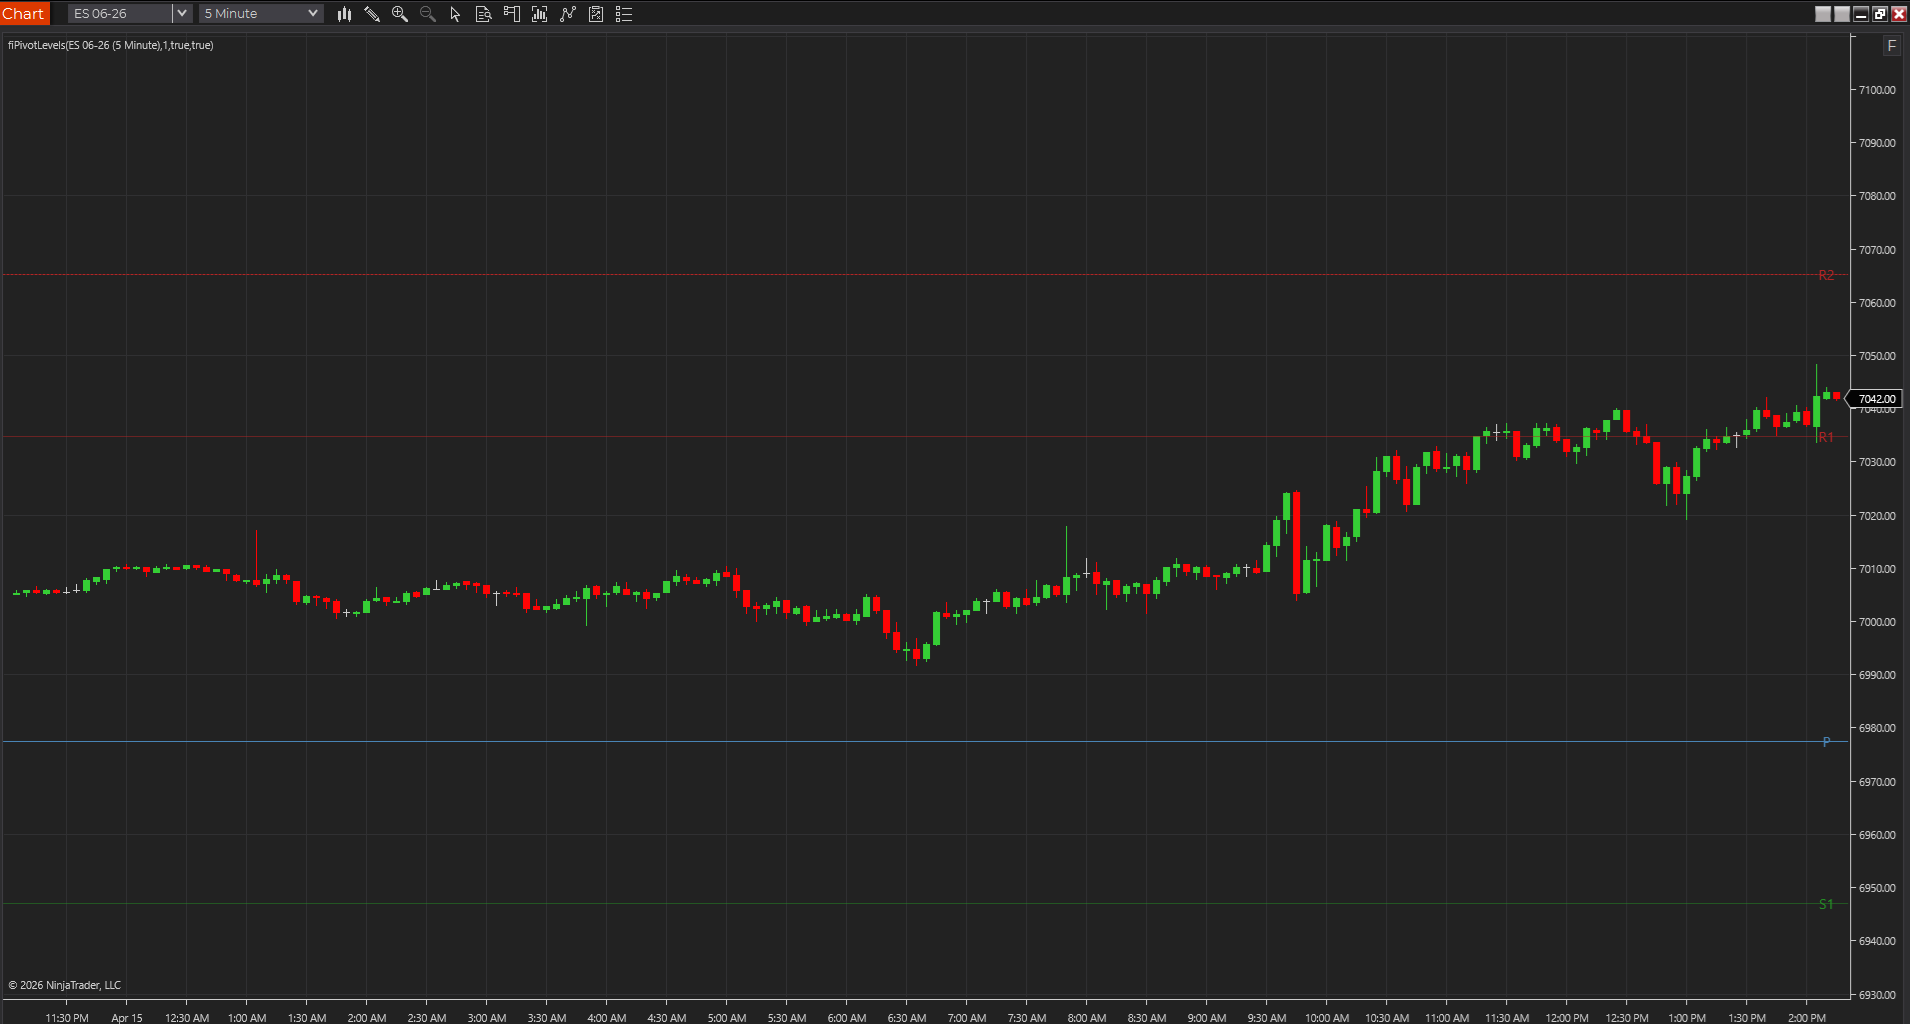
Pivot map on a live session
A chart showing the classic pivot framework with session-derived support and resistance levels already on screen.
Best fit
- Preparing common support and resistance references before the session.
- Comparing intraday reactions around prior-session derived levels.
- Keeping pivot context visible without manual drawing.
Before using it live
- Import the NinjaTrader 8 ZIP through NinjaTrader's normal import flow.
- Apply it to an intraday chart with the session template you trade.
- Confirm the prior session definition matches your market.
- Review how the tool behaves on your actual session template, chart type, and instrument.
Settings to review
Toggles the second support and resistance levels.
Shows P, R1, S1, R2, and S2 labels on the chart.
Controls the thickness of the pivot lines.
Installation notes
- Import the NinjaTrader 8 ZIP through NinjaTrader's normal import flow.
- Apply it to an intraday chart with the session template you trade.
- Confirm the prior session definition matches your market.
Downloads
Source code
These source examples are provided for copy/paste workflows on other charting platforms. Review and test any script in a simulator before using it on a live chart.
{
  Classic Pivot Levels
  FreeIndicators.com source example.
  Works as a starting point for TradeStation EasyLanguage and MultiCharts PowerLanguage.
}

Vars: Pivot(0), R1(0), S1(0), R2(0), S2(0);

If Date <> Date[1] Then Begin
  Pivot = (HighD(1) + LowD(1) + CloseD(1)) / 3;
  R1 = 2 * Pivot - LowD(1);
  S1 = 2 * Pivot - HighD(1);
  R2 = Pivot + HighD(1) - LowD(1);
  S2 = Pivot - HighD(1) + LowD(1);
End;

Plot1(Pivot, "Pivot");
Plot2(R1, "R1");
Plot3(S1, "S1");
Plot4(R2, "R2");
Plot5(S2, "S2");// Classic Pivot Levels
// FreeIndicators.com source example for MetaTrader 4.
#property indicator_chart_window
#property indicator_buffers 3
#property indicator_color1 DodgerBlue
#property indicator_color2 Crimson
#property indicator_color3 SeaGreen
double Buffer1[];
double Buffer2[];
double Buffer3[];
int init() {
SetIndexBuffer(0, Buffer1);
SetIndexBuffer(1, Buffer2);
SetIndexBuffer(2, Buffer3);
return(0);
}
int start() {
int counted = IndicatorCounted();
int limit = Bars - counted - 1;
for(int i = limit; i >= 0; i--) {
int shift = iBarShift(Symbol(), PERIOD_D1, Time[i], true) + 1;
double ph = iHigh(Symbol(), PERIOD_D1, shift);
double pl = iLow(Symbol(), PERIOD_D1, shift);
double pc = iClose(Symbol(), PERIOD_D1, shift);
double pivot = (ph + pl + pc) / 3.0;
Buffer1[i] = pivot;
Buffer2[i] = 2.0 * pivot - pl;
Buffer3[i] = 2.0 * pivot - ph;
}
return(0);
}// Classic Pivot Levels
// FreeIndicators.com source example for MetaTrader 5.
#property indicator_chart_window
#property indicator_buffers 3
#property indicator_plots 3
double Buffer1[];
double Buffer2[];
double Buffer3[];
int OnInit() {
SetIndexBuffer(0, Buffer1, INDICATOR_DATA);
SetIndexBuffer(1, Buffer2, INDICATOR_DATA);
SetIndexBuffer(2, Buffer3, INDICATOR_DATA);
return(INIT_SUCCEEDED);
}
int OnCalculate(const int rates_total,
const int prev_calculated,
const datetime &time[],
const double &open[],
const double &high[],
const double &low[],
const double &close[],
const long &tick_volume[],
const long &volume[],
const int &spread[]) {
int start = prev_calculated > 1 ? prev_calculated - 1 : 1;
for(int i = start; i < rates_total; i++) {
int shift = iBarShift(_Symbol, PERIOD_D1, time[i], true) + 1;
double ph = iHigh(_Symbol, PERIOD_D1, shift);
double pl = iLow(_Symbol, PERIOD_D1, shift);
double pc = iClose(_Symbol, PERIOD_D1, shift);
double pivot = (ph + pl + pc) / 3.0;
Buffer1[i] = pivot;
Buffer2[i] = 2.0 * pivot - pl;
Buffer3[i] = 2.0 * pivot - ph;
}
return(rates_total);
}//@version=5
indicator("Classic Pivot Levels", overlay=true)
prevHigh = request.security(syminfo.tickerid, "D", high[1])
prevLow = request.security(syminfo.tickerid, "D", low[1])
prevClose = request.security(syminfo.tickerid, "D", close[1])
pivot = (prevHigh + prevLow + prevClose) / 3.0
r1 = 2.0 * pivot - prevLow
s1 = 2.0 * pivot - prevHigh
plot(pivot, "Pivot", color=color.blue)
plot(r1, "R1", color=color.red)
plot(s1, "S1", color=color.green)After the download
Keep the next step tied to this exact tool
Install it cleanly, subscribe for future updates if this workflow matters, or move straight into a structured request if the tool needs another platform or a custom version.
Install guide
Keep the workspace stable
Use the clean import flow before a promising download turns into a platform cleanup project.
Open install guideEmail follow-up
Get updates if this tool changes
Use the email signup if you want future indicator and workflow updates without checking back manually.
Join updatesCustom NT8 work
Turn this into a custom NinjaTrader build
Use Moore Tech when the free indicator needs a private modification, NT8 repair, platform port, alert upgrade, or strategy version built around your exact rules.
Paid next step
Get the Daily Trading Plan PDF after the download
Use the $29.99 PDF when you want the key levels, scenarios, and invalidation points mapped before the session instead of building the day from scratch.
Daily Trading Plan PDF - $29.99Limitations
- Session templates directly affect the levels.
- Classic pivots are references, not entry signals.
- Markets can ignore pivots during strong news or trend conditions.
Frequently asked questions
Does it repaint?
This indicator is designed as a chart reference tool, not as a hindsight-only backfitted signal. Even so, you should still test it bar by bar on your chart type to confirm how it behaves on the active bar.
Which platforms are covered?
NinjaTrader 8, TradeStation EasyLanguage, MultiCharts PowerLanguage, MetaTrader 4, MetaTrader 5, TradingView Pine Script are currently represented through downloads or source pages.
Is source code included?
Yes. This page includes source examples or links to platform-specific source pages where applicable.