What it does
Automatic Fibonacci Levels holds the common retracement prices from the recent high-low swing directly on the chart. It is built for traders who want fast pullback context, not a hand-drawn swing workflow every session.
Who this is for
This page is aimed at traders who already know what problem Automatic Fibonacci Levels is solving and want clearer notes on setup, tradeoffs, and platform coverage.
Key terms for this tool
Review the core trading and platform terms tied to this page before changing settings or using the study in a live workspace.
What it is not
Automatic Fibonacci Levels is a chart-context tool. It does not place trades, manage risk automatically, or promise that a specific pattern will resolve in one direction. Use it to organize decisions, not to outsource them.
Chart examples
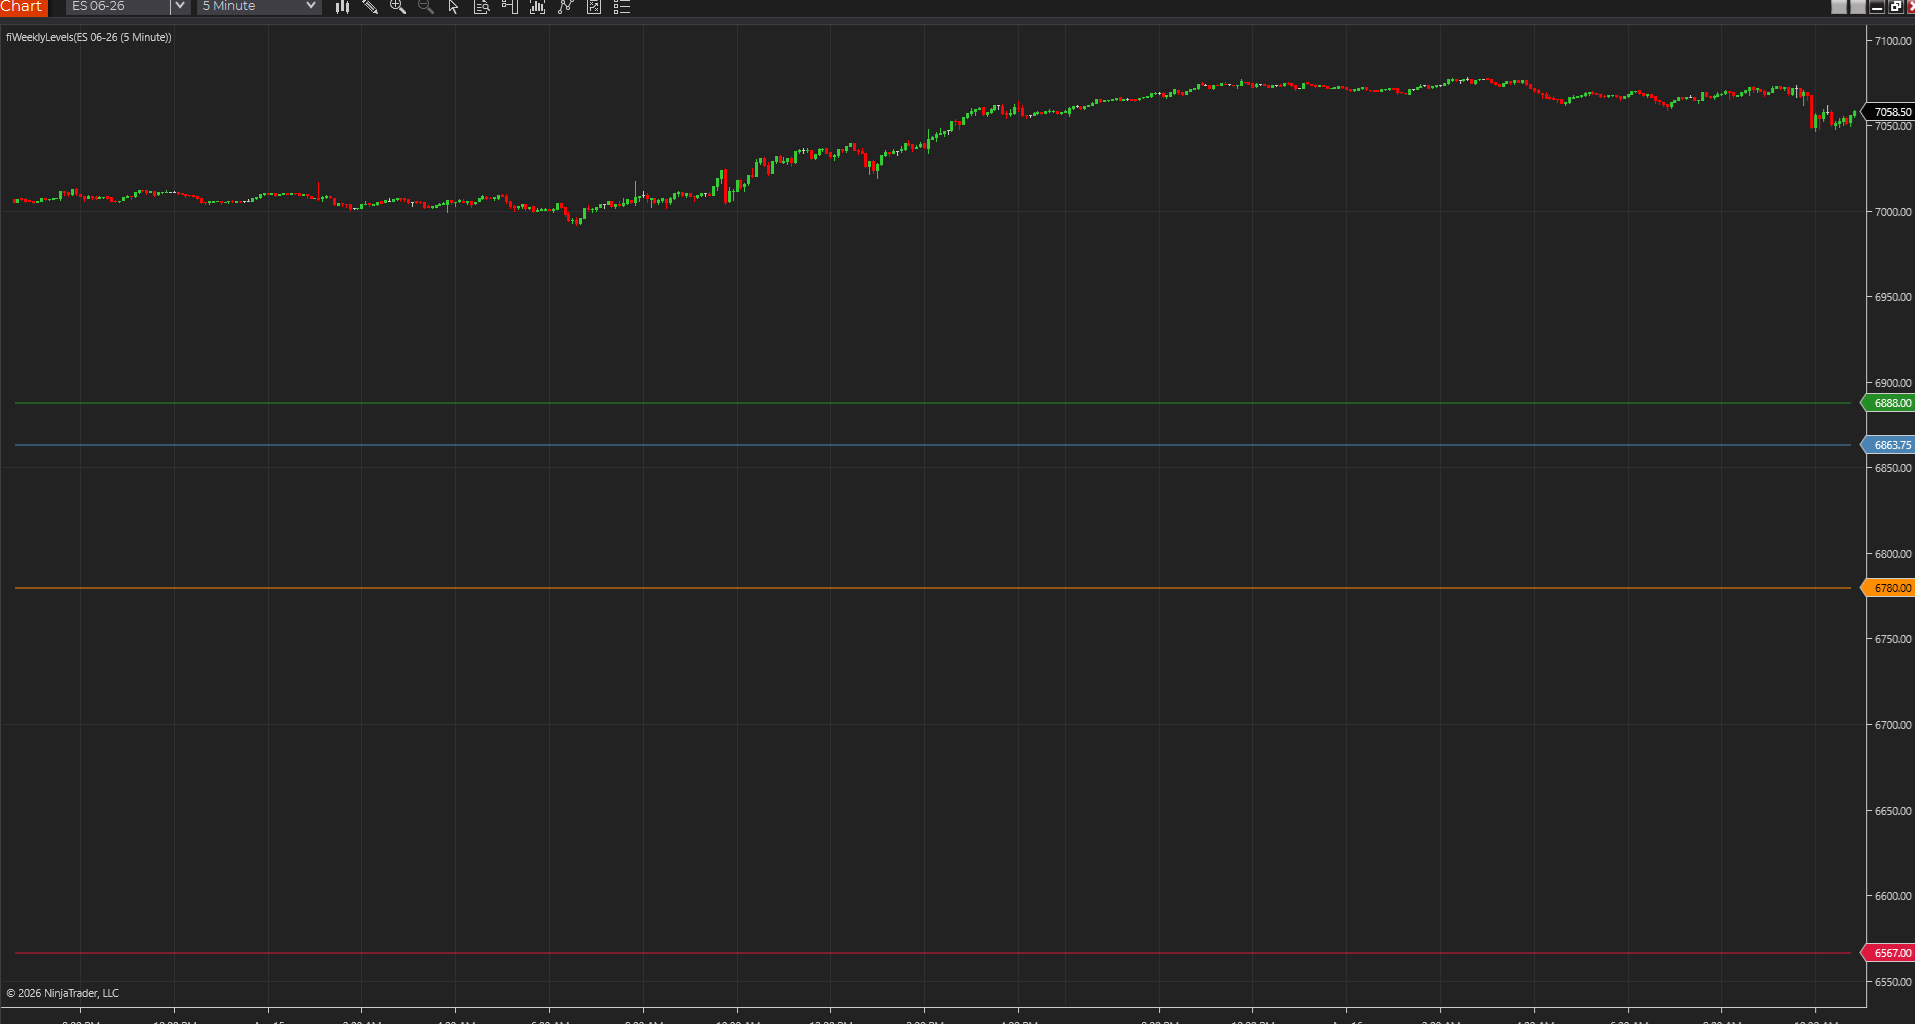
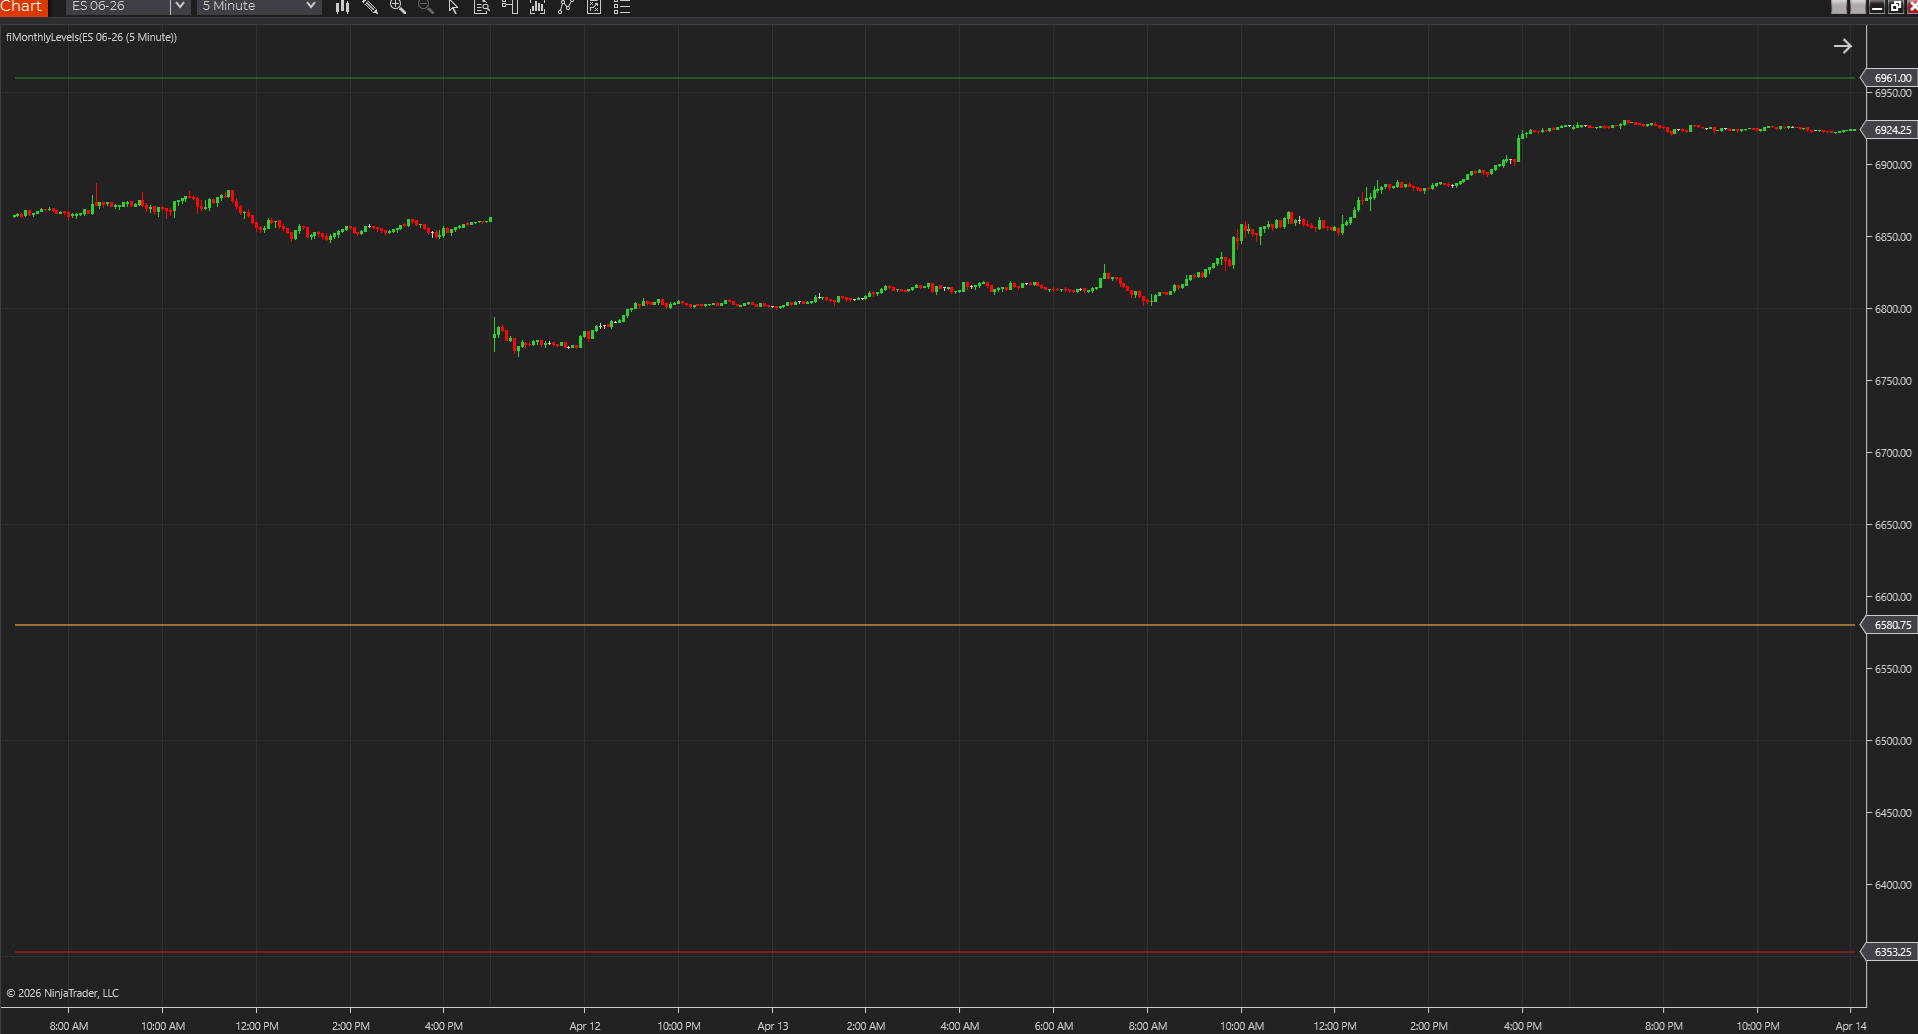
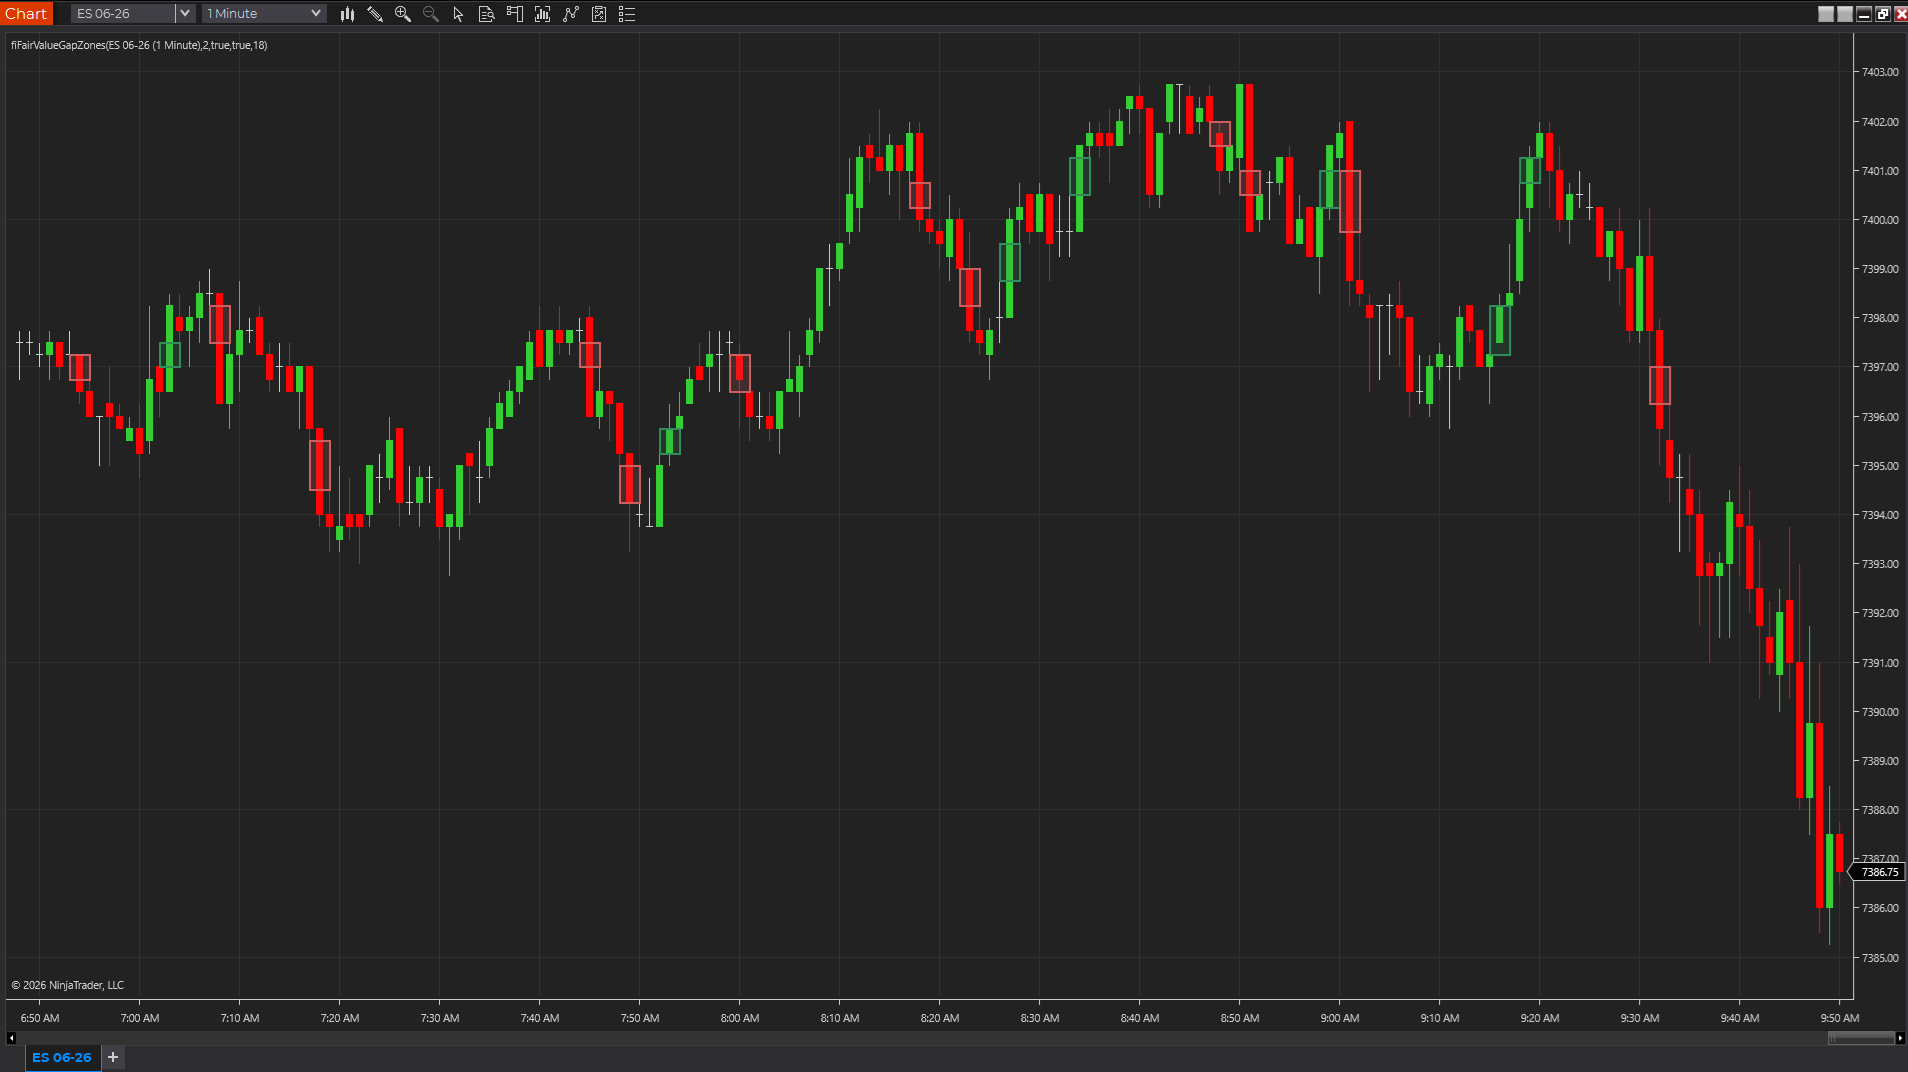
This chart capture shows the study on a real NinjaTrader workspace. Use it as visual reference, then confirm behavior on your own instrument, session, and timeframe.
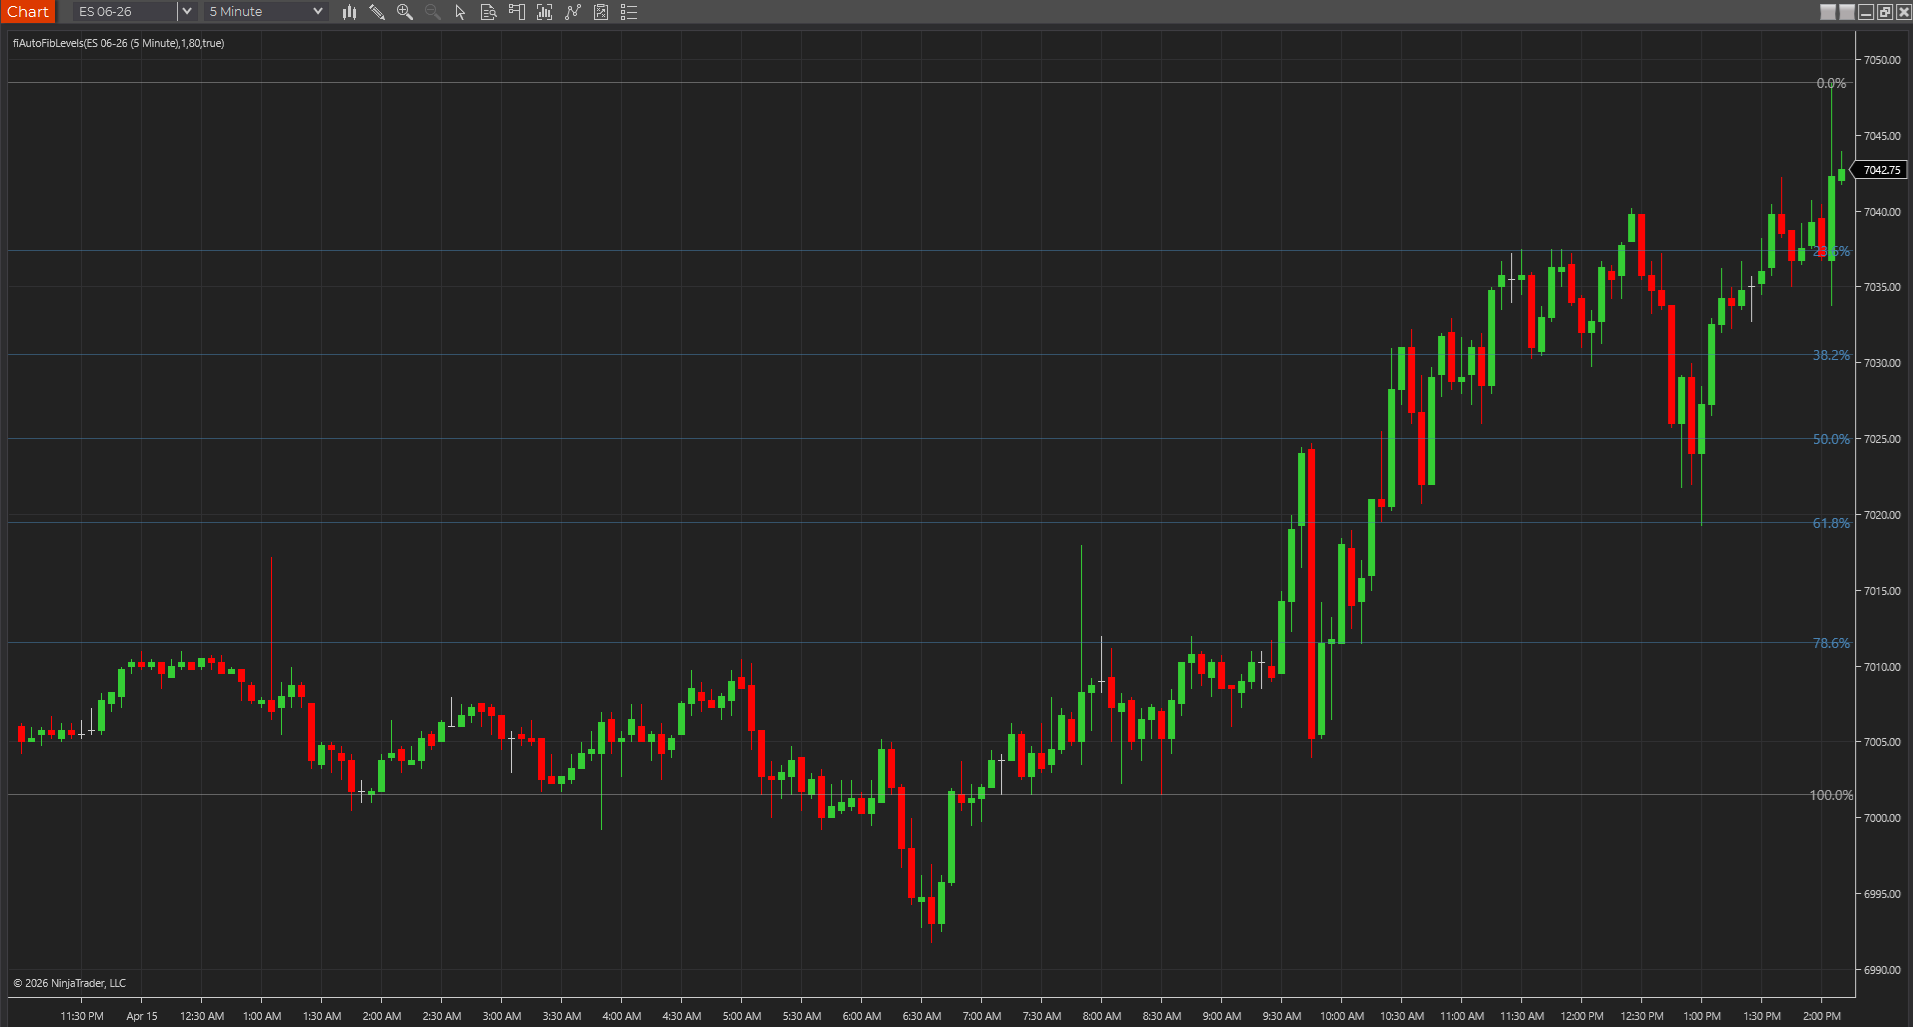
Retracement levels on a live chart
A chart showing the recent swing range with automatic Fibonacci retracement levels held on screen for pullback reference.
Best fit
- Finding simple pullback reference zones during a trending session.
- Keeping recent high-to-low or low-to-high retracement levels visible.
- Building a repeatable retracement workflow without manual drawing.
Before using it live
- Import the NinjaTrader 8 ZIP through NinjaTrader's normal import flow.
- Apply it to a chart with enough historical bars for swing detection.
- Tune the lookback before using the levels in live decisions.
- Review how the tool behaves on your actual session template, chart type, and instrument.
Settings to review
Controls how many bars are scanned for the recent high and low.
Toggles the 23.6%, 38.2%, 50%, 61.8%, and 78.6% labels.
Controls the thickness of the reference levels.
Installation notes
- Import the NinjaTrader 8 ZIP through NinjaTrader's normal import flow.
- Apply it to a chart with enough historical bars for swing detection.
- Tune the lookback before using the levels in live decisions.
Downloads
Source code
These source examples are provided for copy/paste workflows on other charting platforms. Review and test any script in a simulator before using it on a live chart.
{
  Automatic Fibonacci Levels
  FreeIndicators.com source example.
  Works as a starting point for TradeStation EasyLanguage and MultiCharts PowerLanguage.
}

Inputs: Lookback(80);
Vars: SwingHigh(0), SwingLow(0), RangeValue(0);

SwingHigh = Highest(High, Lookback);
SwingLow = Lowest(Low, Lookback);
RangeValue = SwingHigh - SwingLow;

Plot1(SwingLow + RangeValue * 0.236, "23.6");
Plot2(SwingLow + RangeValue * 0.382, "38.2");
Plot3(SwingLow + RangeValue * 0.500, "50.0");
Plot4(SwingLow + RangeValue * 0.618, "61.8");
Plot5(SwingLow + RangeValue * 0.786, "78.6");// Automatic Fibonacci Levels
// FreeIndicators.com source example for MetaTrader 4.
#property indicator_chart_window
#property indicator_buffers 3
#property indicator_color1 DodgerBlue
#property indicator_color2 Crimson
#property indicator_color3 SeaGreen
double Buffer1[];
double Buffer2[];
double Buffer3[];
int init() {
SetIndexBuffer(0, Buffer1);
SetIndexBuffer(1, Buffer2);
SetIndexBuffer(2, Buffer3);
return(0);
}
int start() {
int counted = IndicatorCounted();
int limit = Bars - counted - 1;
int lookback = 80;
for(int i = limit; i >= 0; i--) {
int hi = iHighest(NULL, 0, MODE_HIGH, lookback, i);
int lo = iLowest(NULL, 0, MODE_LOW, lookback, i);
double range = High[hi] - Low[lo];
Buffer1[i] = Low[lo] + range * 0.382;
Buffer2[i] = Low[lo] + range * 0.500;
Buffer3[i] = Low[lo] + range * 0.618;
}
return(0);
}// Automatic Fibonacci Levels
// FreeIndicators.com source example for MetaTrader 5.
#property indicator_chart_window
#property indicator_buffers 3
#property indicator_plots 3
double Buffer1[];
double Buffer2[];
double Buffer3[];
int OnInit() {
SetIndexBuffer(0, Buffer1, INDICATOR_DATA);
SetIndexBuffer(1, Buffer2, INDICATOR_DATA);
SetIndexBuffer(2, Buffer3, INDICATOR_DATA);
return(INIT_SUCCEEDED);
}
int OnCalculate(const int rates_total,
const int prev_calculated,
const datetime &time[],
const double &open[],
const double &high[],
const double &low[],
const double &close[],
const long &tick_volume[],
const long &volume[],
const int &spread[]) {
int start = prev_calculated > 1 ? prev_calculated - 1 : 1;
int lookback = 80;
for(int i = start; i < rates_total; i++) {
double swingHigh = high[i];
double swingLow = low[i];
for(int j = 1; j < lookback && i - j >= 0; j++) {
swingHigh = MathMax(swingHigh, high[i - j]);
swingLow = MathMin(swingLow, low[i - j]);
}
double range = swingHigh - swingLow;
Buffer1[i] = swingLow + range * 0.382;
Buffer2[i] = swingLow + range * 0.500;
Buffer3[i] = swingLow + range * 0.618;
}
return(rates_total);
}//@version=5
indicator("Automatic Fibonacci Levels", overlay=true)
lookback = input.int(80, "Lookback", minval=10)
swingHigh = ta.highest(high, lookback)
swingLow = ta.lowest(low, lookback)
r = swingHigh - swingLow
plot(swingLow + r * 0.236, "23.6%", color=color.gray)
plot(swingLow + r * 0.382, "38.2%", color=color.blue)
plot(swingLow + r * 0.500, "50.0%", color=color.orange)
plot(swingLow + r * 0.618, "61.8%", color=color.green)
plot(swingLow + r * 0.786, "78.6%", color=color.purple)After the download
Keep the next step tied to this exact tool
Install it cleanly, subscribe for future updates if this workflow matters, or move straight into a structured request if the tool needs another platform or a custom version.
Install guide
Keep the workspace stable
Use the clean import flow before a promising download turns into a platform cleanup project.
Open install guideEmail follow-up
Get updates if this tool changes
Use the email signup if you want future indicator and workflow updates without checking back manually.
Join updatesCustom NT8 work
Turn this into a custom NinjaTrader build
Use Moore Tech when the free indicator needs a private modification, NT8 repair, platform port, alert upgrade, or strategy version built around your exact rules.
Paid next step
Get the Daily Trading Plan PDF after the download
Use the $29.99 PDF when you want the key levels, scenarios, and invalidation points mapped before the session instead of building the day from scratch.
Daily Trading Plan PDF - $29.99Limitations
- Levels update as the lookback high or low changes.
- Retracement levels are context, not guarantees.
- A fixed lookback may not match every market condition.
Frequently asked questions
Does it repaint?
This tool can revise its most recent labels or levels until enough bars have formed to confirm the swing or range it is using. Older confirmed values should be more stable than the most recent developing ones.
Which platforms are covered?
NinjaTrader 8, TradeStation EasyLanguage, MultiCharts PowerLanguage, MetaTrader 4, MetaTrader 5, TradingView Pine Script are currently represented through downloads or source pages.
Is source code included?
Yes. This page includes source examples or links to platform-specific source pages where applicable.