Guide walkthrough
Start reading here
This is the main article body, where the page shifts from summary cards into the actual workflow and decision-making notes.
On this page
Key terms for this guide
These glossary pages cover the ideas and platform language most likely to matter as you work through this guide.
Trend indicators should simplify, not decorate
The best trend-following indicators make the current state easier to read. They should tell you whether price is trending cleanly, pulling back into a usable area, or starting to lose alignment.
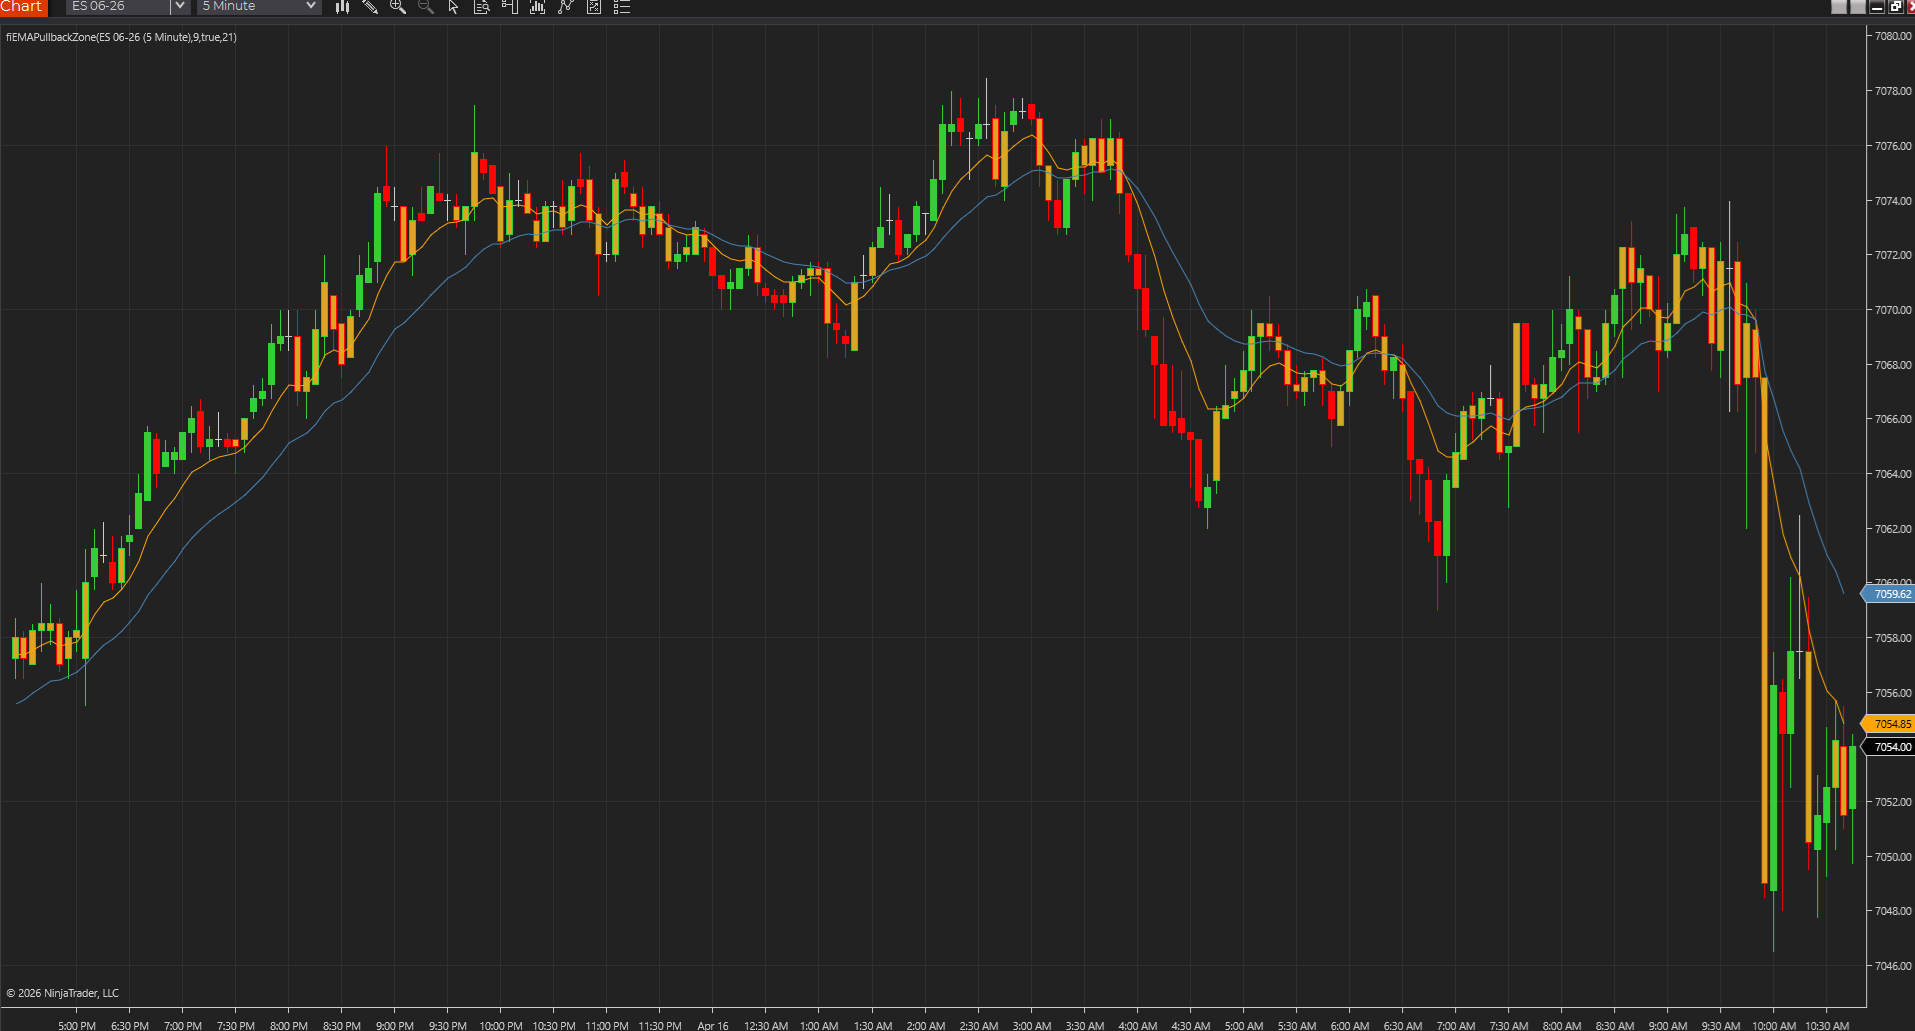
Use a pullback zone when the chart needs less weight
A simple EMA pullback zone is strong when you want a focused answer to one question: is price coming back into a trend area that still looks tradable?
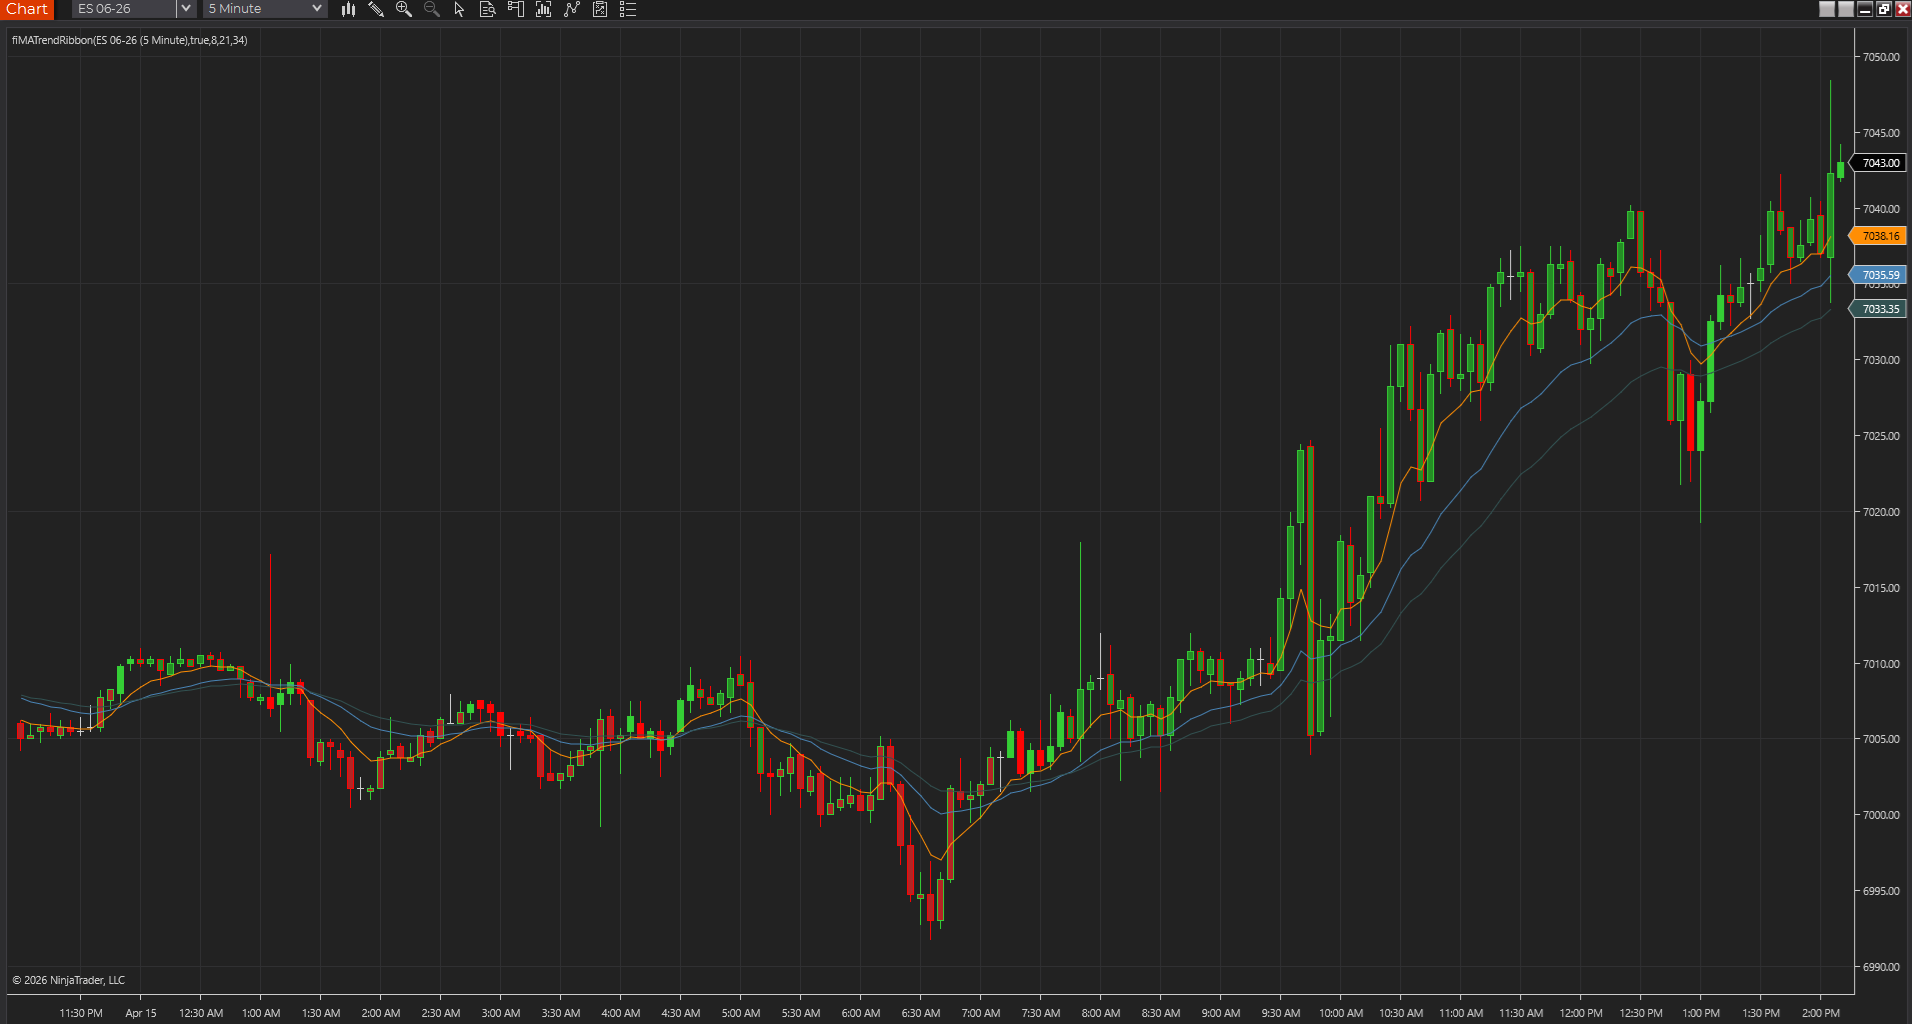
Use a ribbon when alignment is the real question
A trend ribbon earns its space when you want to know whether multiple averages are aligned, flattening, or compressing. That is broader information than a simple pullback tool provides.
Pair trend tools with structure or risk
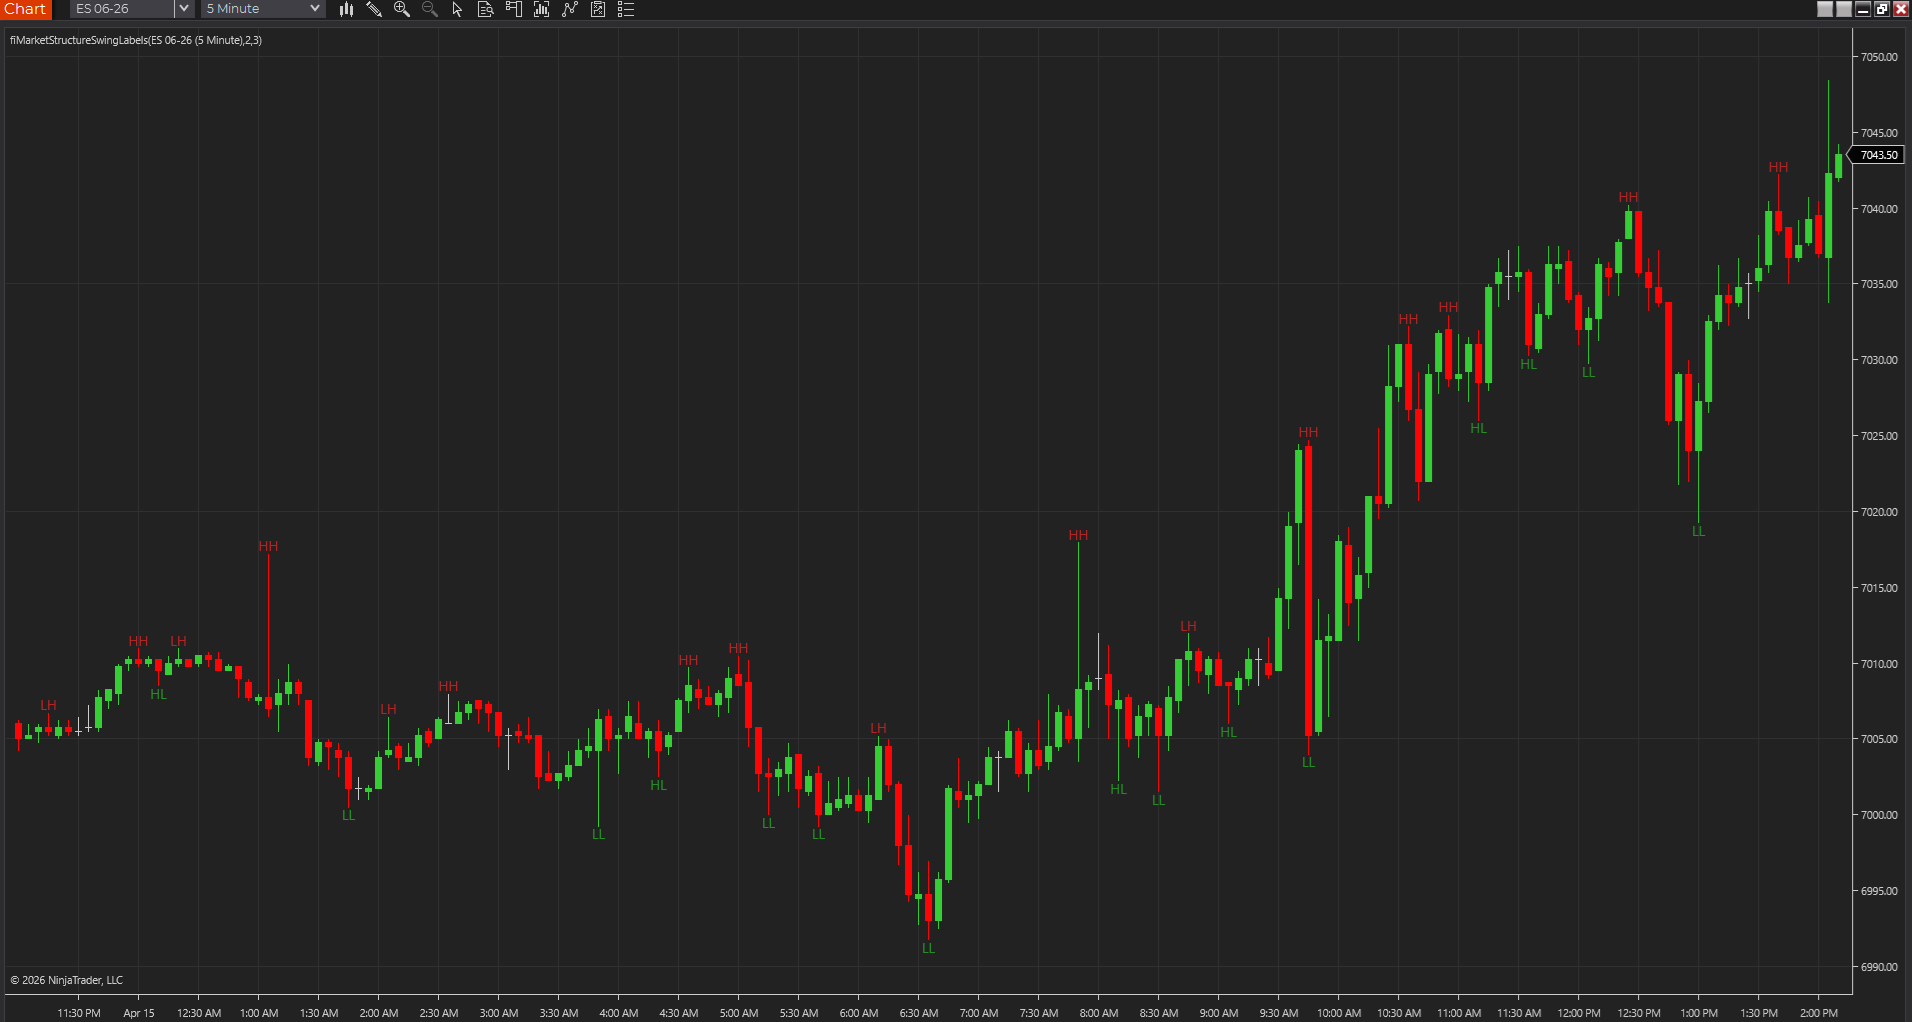
Trend indicators become more reliable when structure labels or ATR-based risk context are nearby. One shows whether the move still looks organized; the other keeps the trade location honest.
Best next reads
These pages pick up the questions most readers usually have next, so you do not have to back out and start a fresh search.