Guide walkthrough
Start reading here
This is the main article body, where the page shifts from summary cards into the actual workflow and decision-making notes.
On this page
Key terms for this guide
These glossary pages cover the ideas and platform language most likely to matter as you work through this guide.
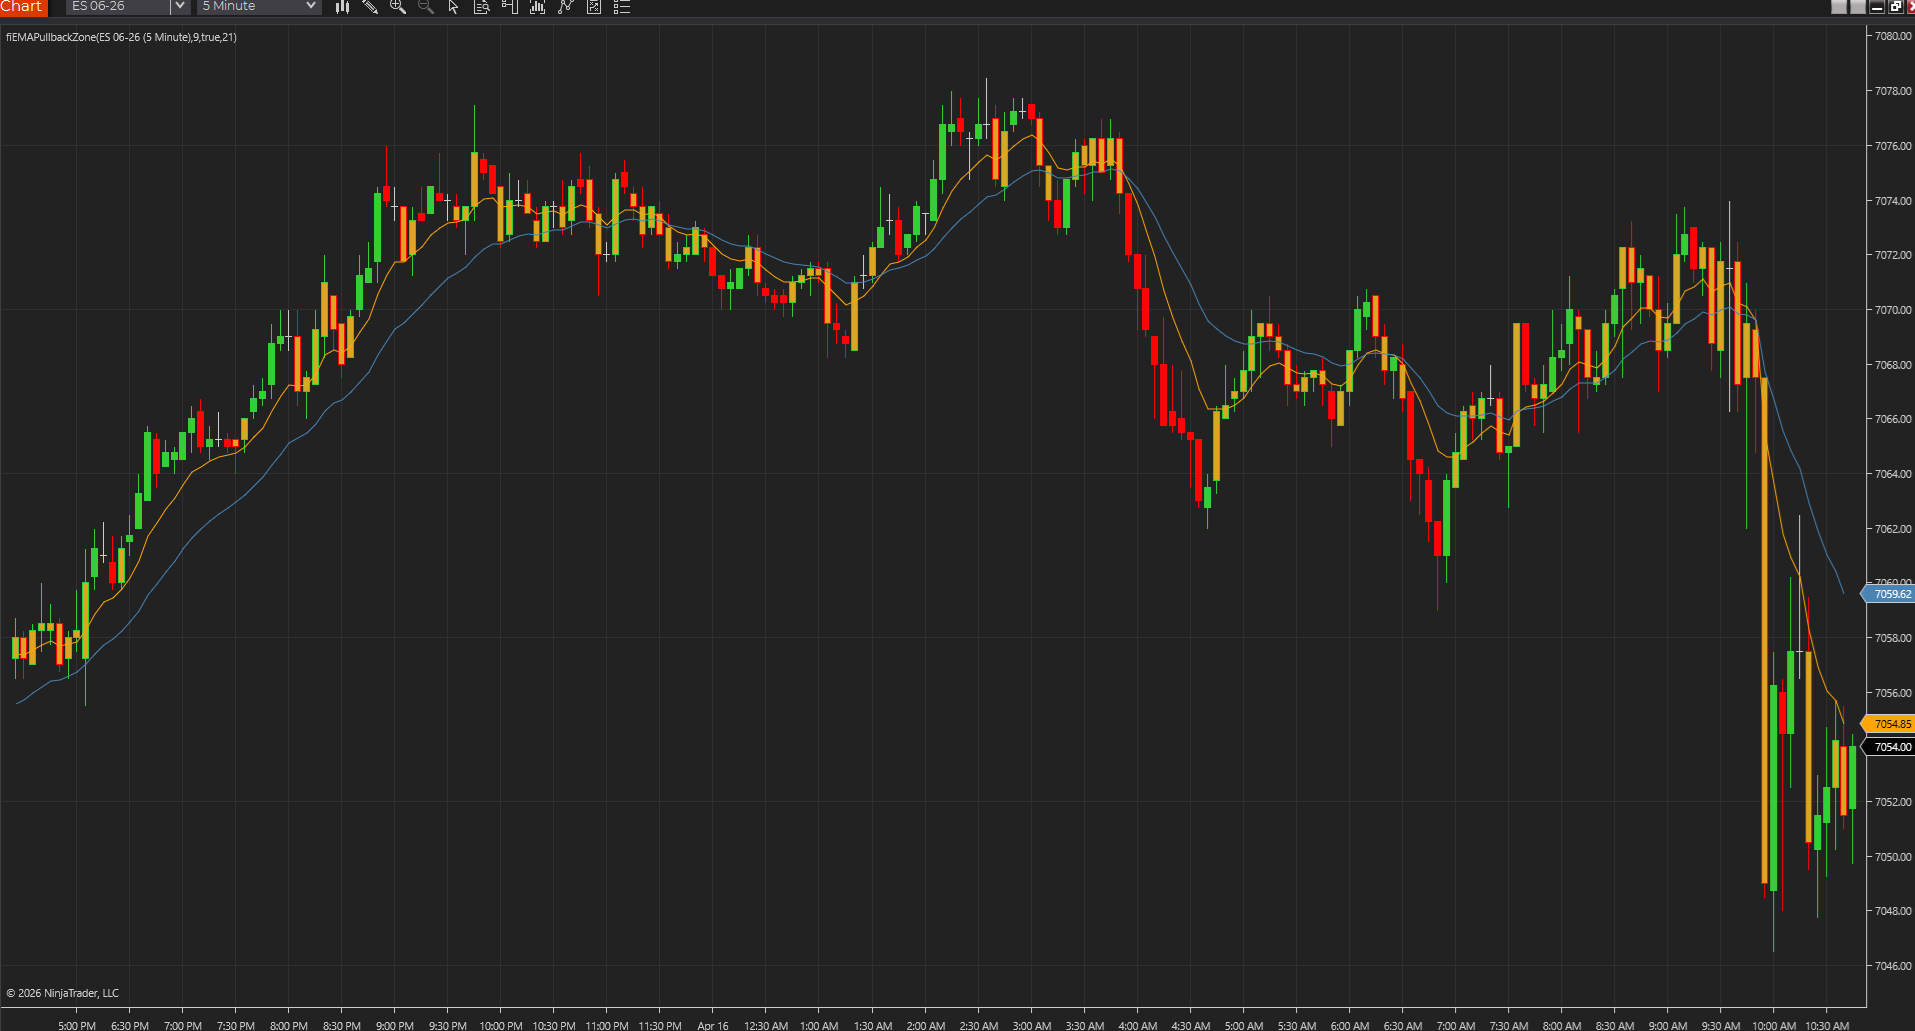
Pullback zones are tighter and simpler
A two-line EMA pullback zone is best when your question is narrow: is price pulling back into a trend area that still looks usable?
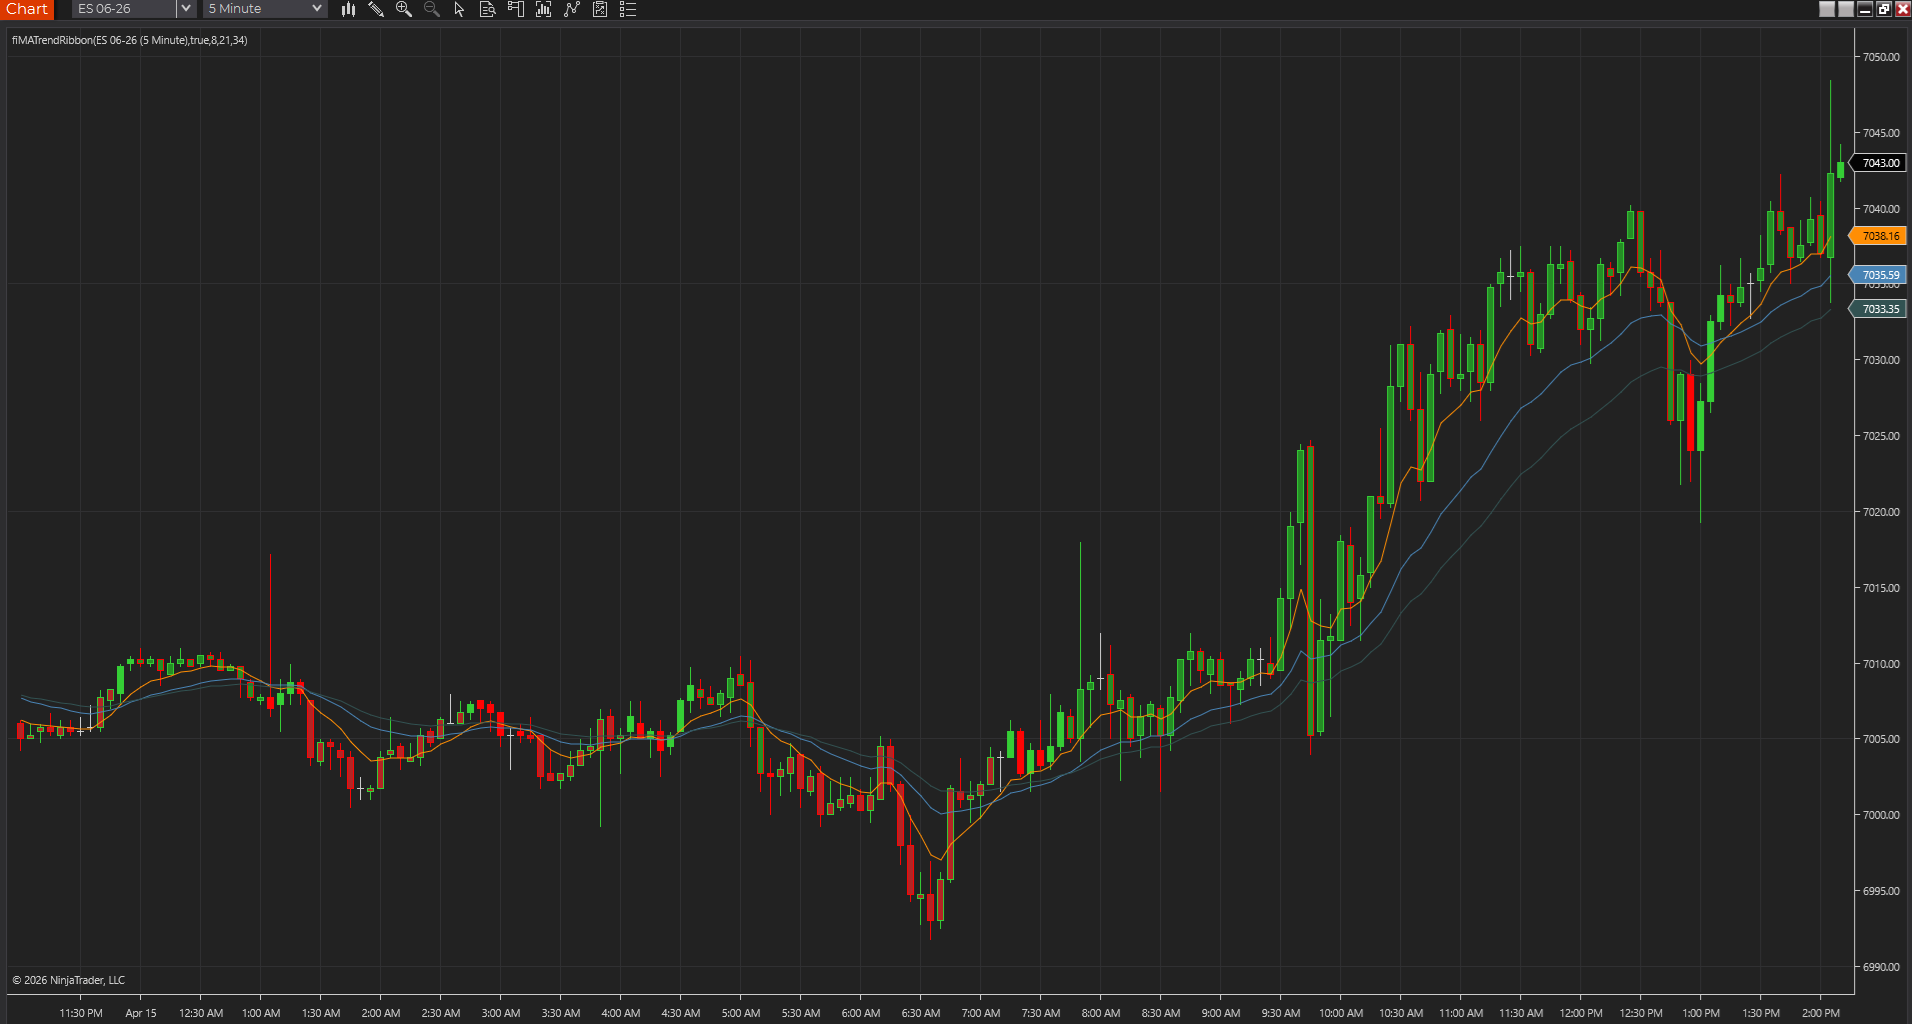
Ribbons show more alignment detail
A moving-average ribbon gives a broader picture of trend stacking and compression, but it also adds more visual weight to the chart.
Choose by how much structure you need
If you want a cleaner chart and a simple pullback framework, use the zone. If you want to see whether multiple moving averages are aligned or compressing, use the ribbon.
Best next reads
These pages pick up the questions most readers usually have next, so you do not have to back out and start a fresh search.