Guide walkthrough
Start reading here
This is the main article body, where the page shifts from summary cards into the actual workflow and decision-making notes.
On this page
Key terms for this guide
These glossary pages cover the ideas and platform language most likely to matter as you work through this guide.
Start with the job, not the indicator name
The cleanest way to choose a trading indicator is to ask what job needs to be done on the chart. Most traders need help with location, participation, structure, or risk long before they need anything exotic.
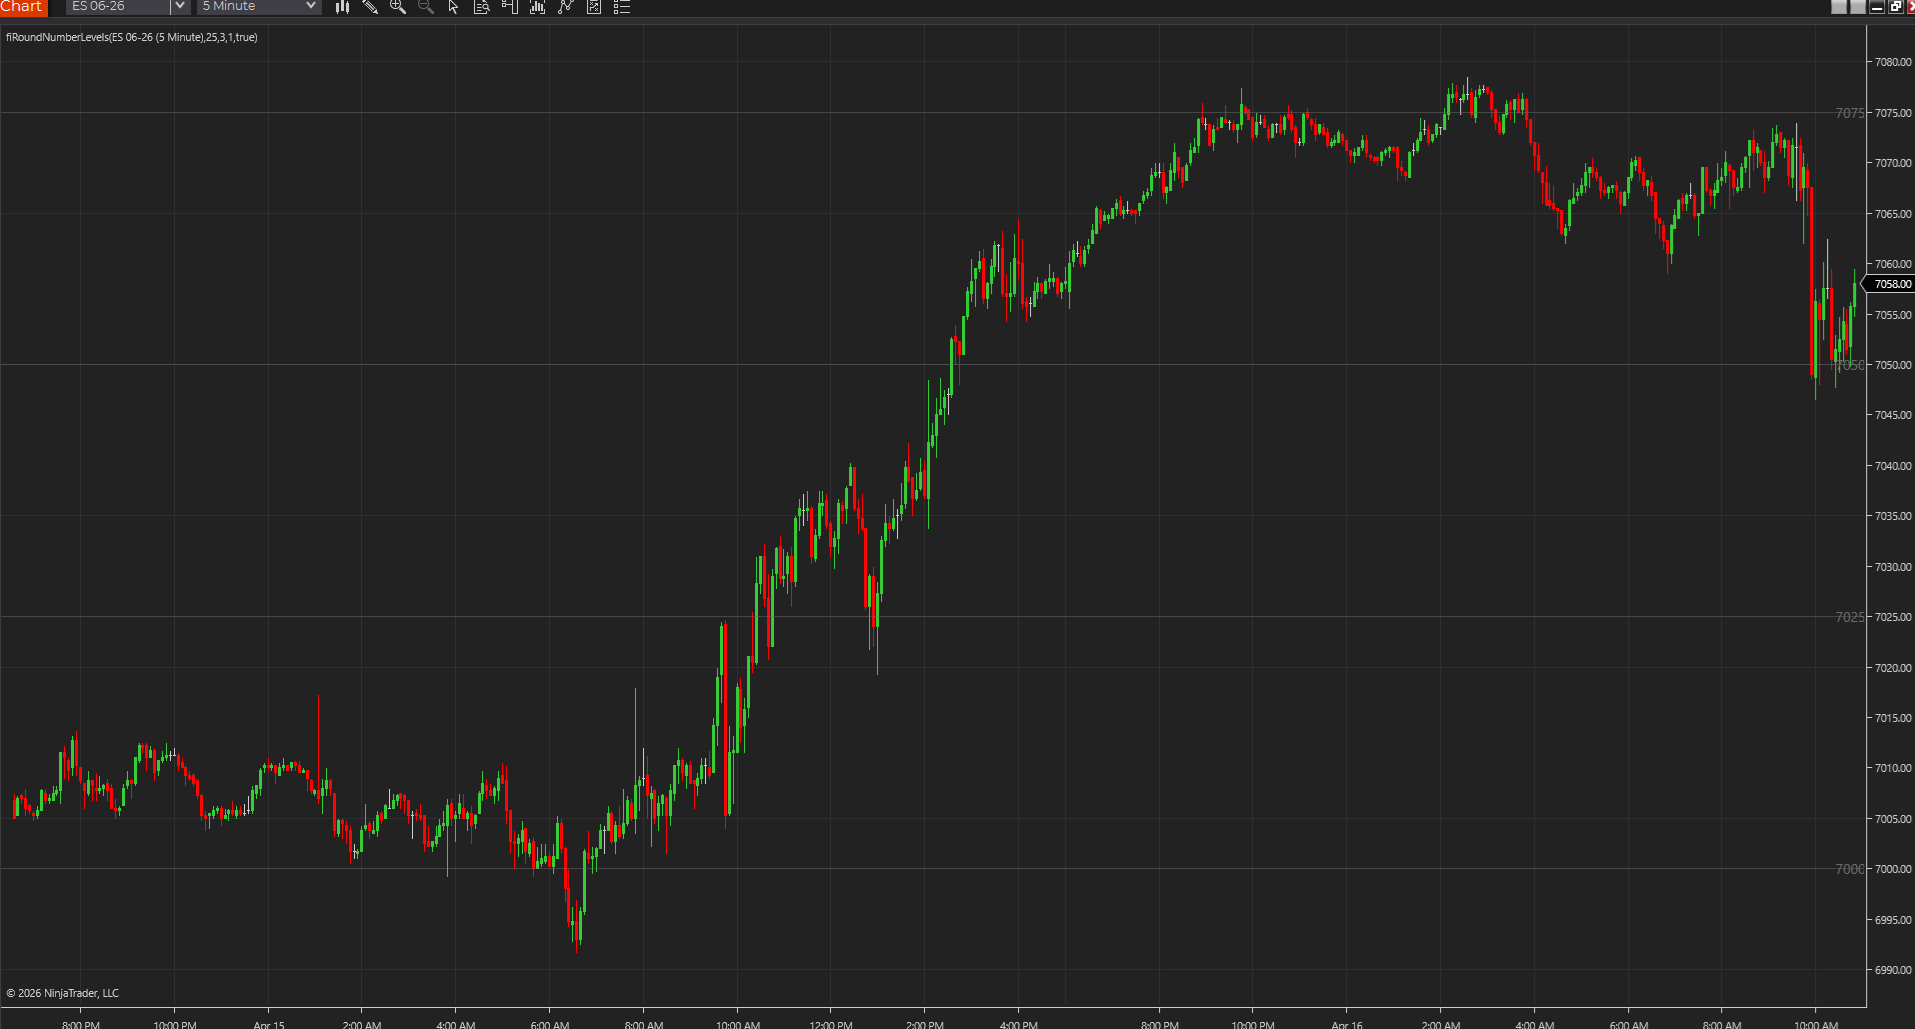
- Location tools tell you where price is trading relative to meaningful levels.
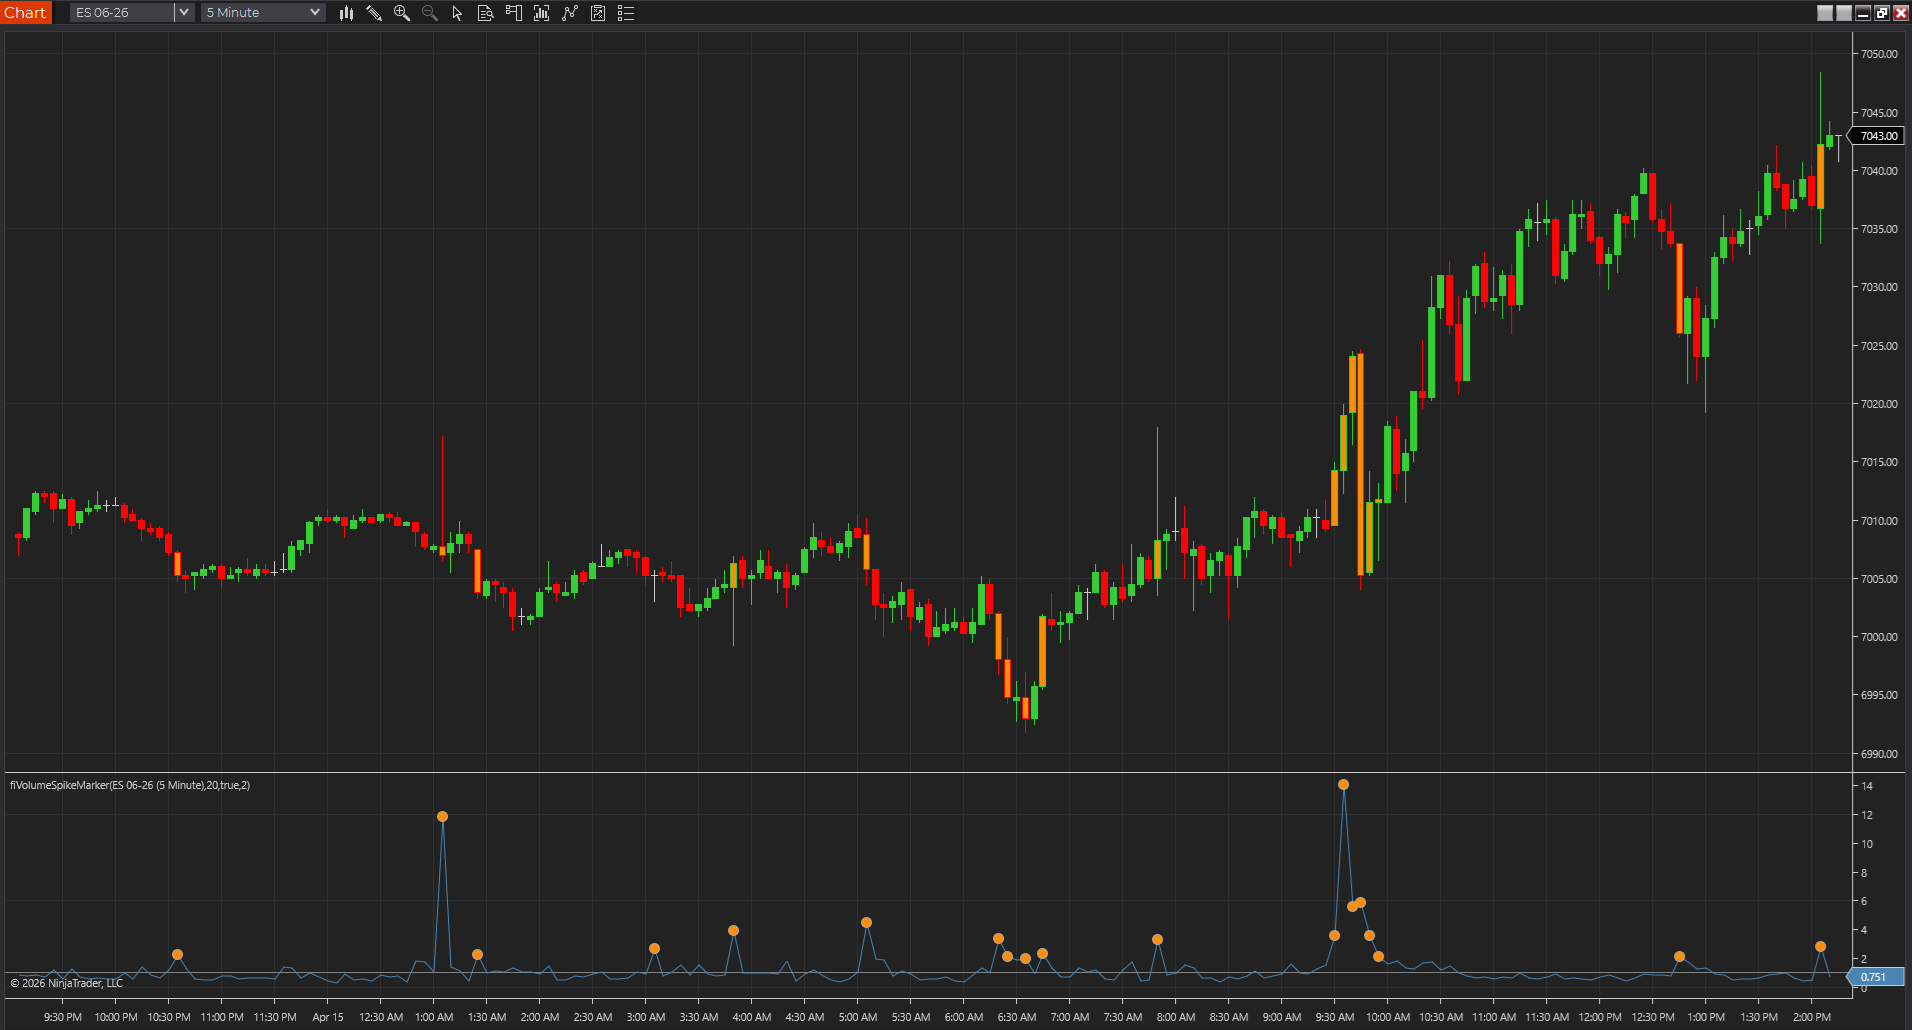
- Participation tools tell you whether activity is expanding, confirming, or drying up.
- Risk tools remind you how much room the market is really using.
Use one tool per job at first
A chart gets noisy fast when several indicators solve the same problem in slightly different ways. Most traders learn faster from one clear tool per job than from a stack of near-duplicates.
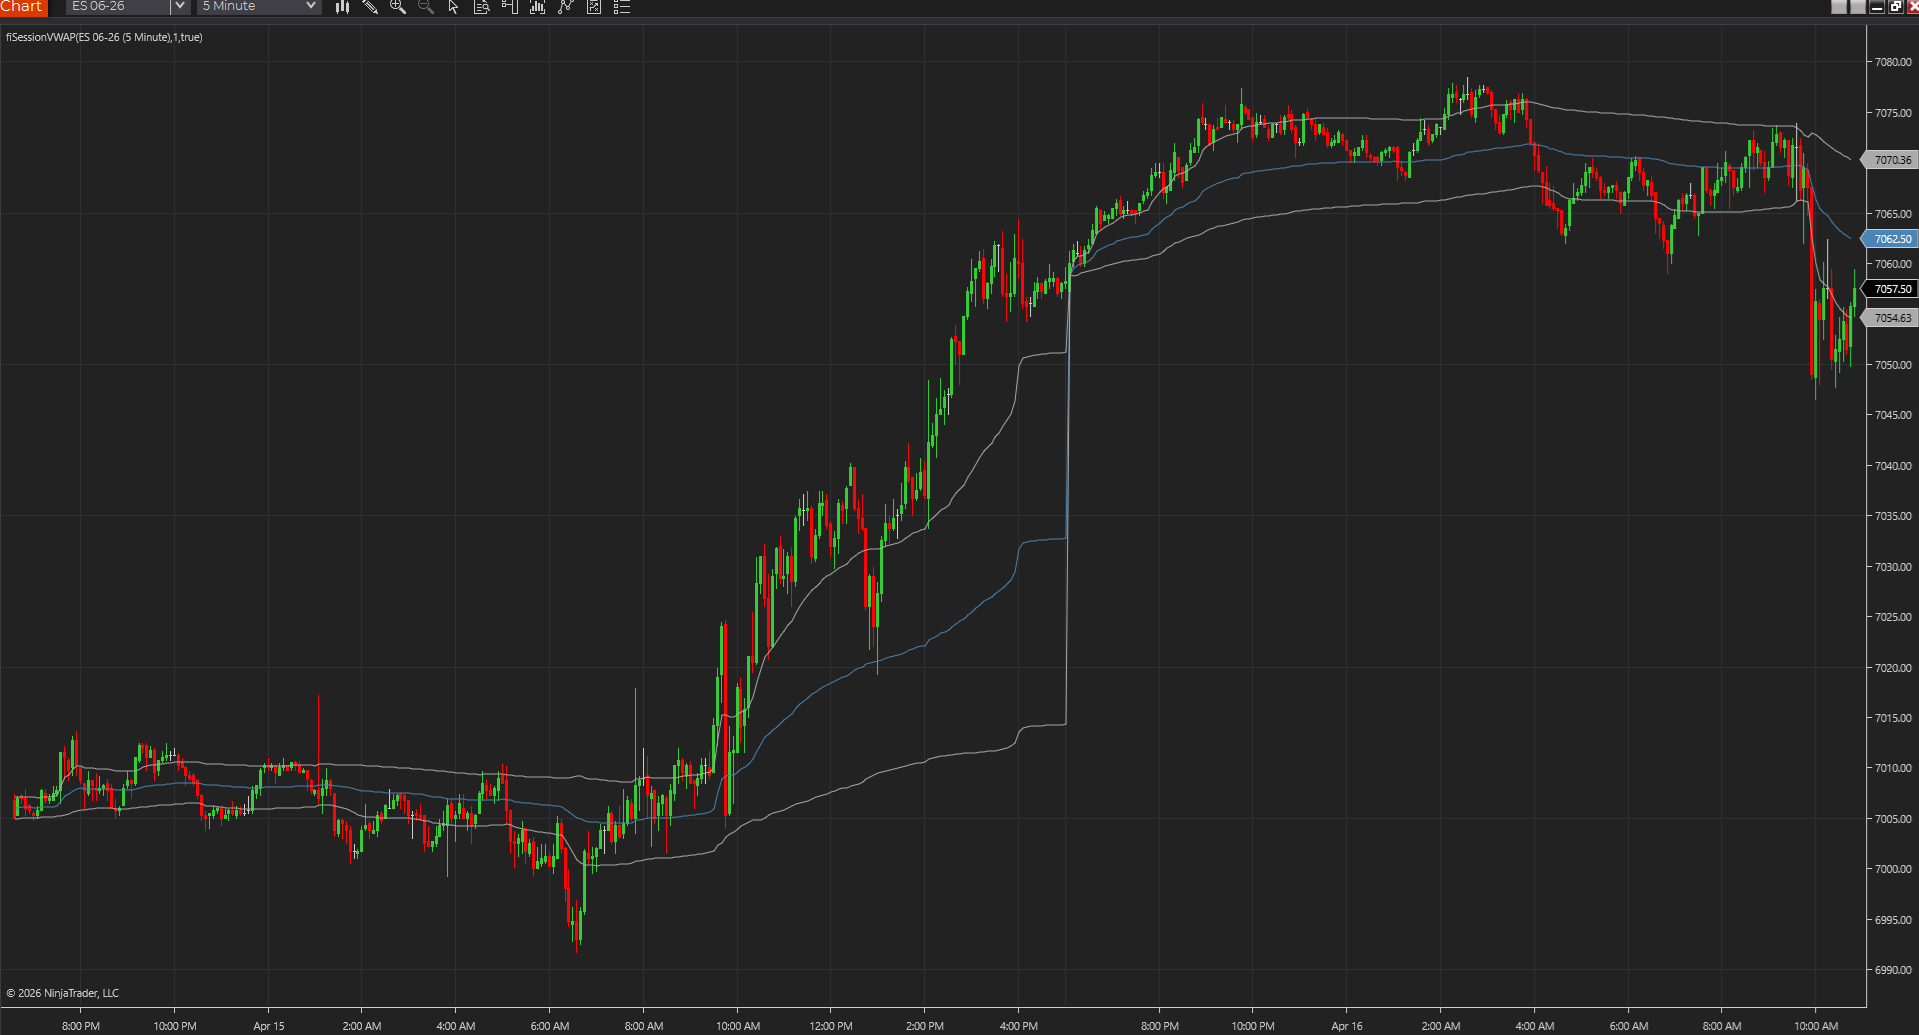
- A session VWAP and a faster VWAP variant should only coexist when they answer different questions.
- A breakout chart rarely needs three separate breakout overlays.
- If two tools constantly disagree, simplify before adding more.
Match the indicator to the market and chart type
An indicator that reads well on a five-minute futures chart might feel clumsy on a Renko chart or on a market with weaker volume data. Picking the right tool means respecting what the market can actually tell you.
- Volume and VWAP tools tend to be cleaner on markets with stronger centralized volume.
- Price-action and level tools usually travel better across chart types.
- Fast tempo tools should be tested on the exact chart style you trade.
Favor readability over novelty
If you cannot explain what an indicator is showing in one or two sentences, it is probably a poor starting point. The strongest charts are often the simple ones that keep the answer visible.
- A good indicator shortens the time it takes to understand the chart.
- A cluttered chart usually slows reaction time instead of improving it.
- Simple tools gain power when they are combined thoughtfully.
Use product pages to validate the choice
Once you think you know the job, the product pages help you confirm whether the tool is actually a fit. That is where screenshots, settings, platform support, and limitations stop the wrong install before it happens.
- Check the page summary to see the real problem the tool solves.
- Review settings and limitations before assuming it fits your workflow.
- Prefer real downloads and chart captures when you are ready to test.
Improve the workflow before you expand the chart
Most traders should tighten up the workflow they already have before adding more indicators. The right improvement is usually better tool choice, not just more tools on the screen.
- Choose one missing context element and solve for that gap.
- Remove the tool that adds the least clarity before adding a new one.
- A chart that stays readable is easier to trust in real time.
Best next reads
These pages pick up the questions most readers usually have next, so you do not have to back out and start a fresh search.
Frequently asked questions
How many indicators should most traders use on one chart?
Usually only a few. One level/context tool, one participation or structure tool, and one risk reference is often enough for a strong starting workflow.
Should I choose indicators by platform first or by workflow first?
Start with workflow first. Once you know the job that needs solving, platform support becomes much easier to evaluate.
What is the easiest sign that a chart has too many indicators?
If the chart takes longer to read after the tools are added, or several indicators are telling the same story in different ways, it is probably overbuilt.