What it does
Opening Range Levels draws the high, low, and midpoint of a configurable opening window so early-session structure stays in view. It is useful when you want a clean reference for breakouts, failed moves, and balance-to-expansion transitions.
Who this is for
This page is a good fit for traders who want a readable Opening Range Levels workflow without having to reverse-engineer the setup from forum posts or screenshots.
Key terms for this tool
Review the core trading and platform terms tied to this page before changing settings or using the study in a live workspace.
What it is not
Opening Range Levels is a chart-context tool. It does not place trades, manage risk automatically, or promise that a specific pattern will resolve in one direction. Use it to organize decisions, not to outsource them.
Chart examples
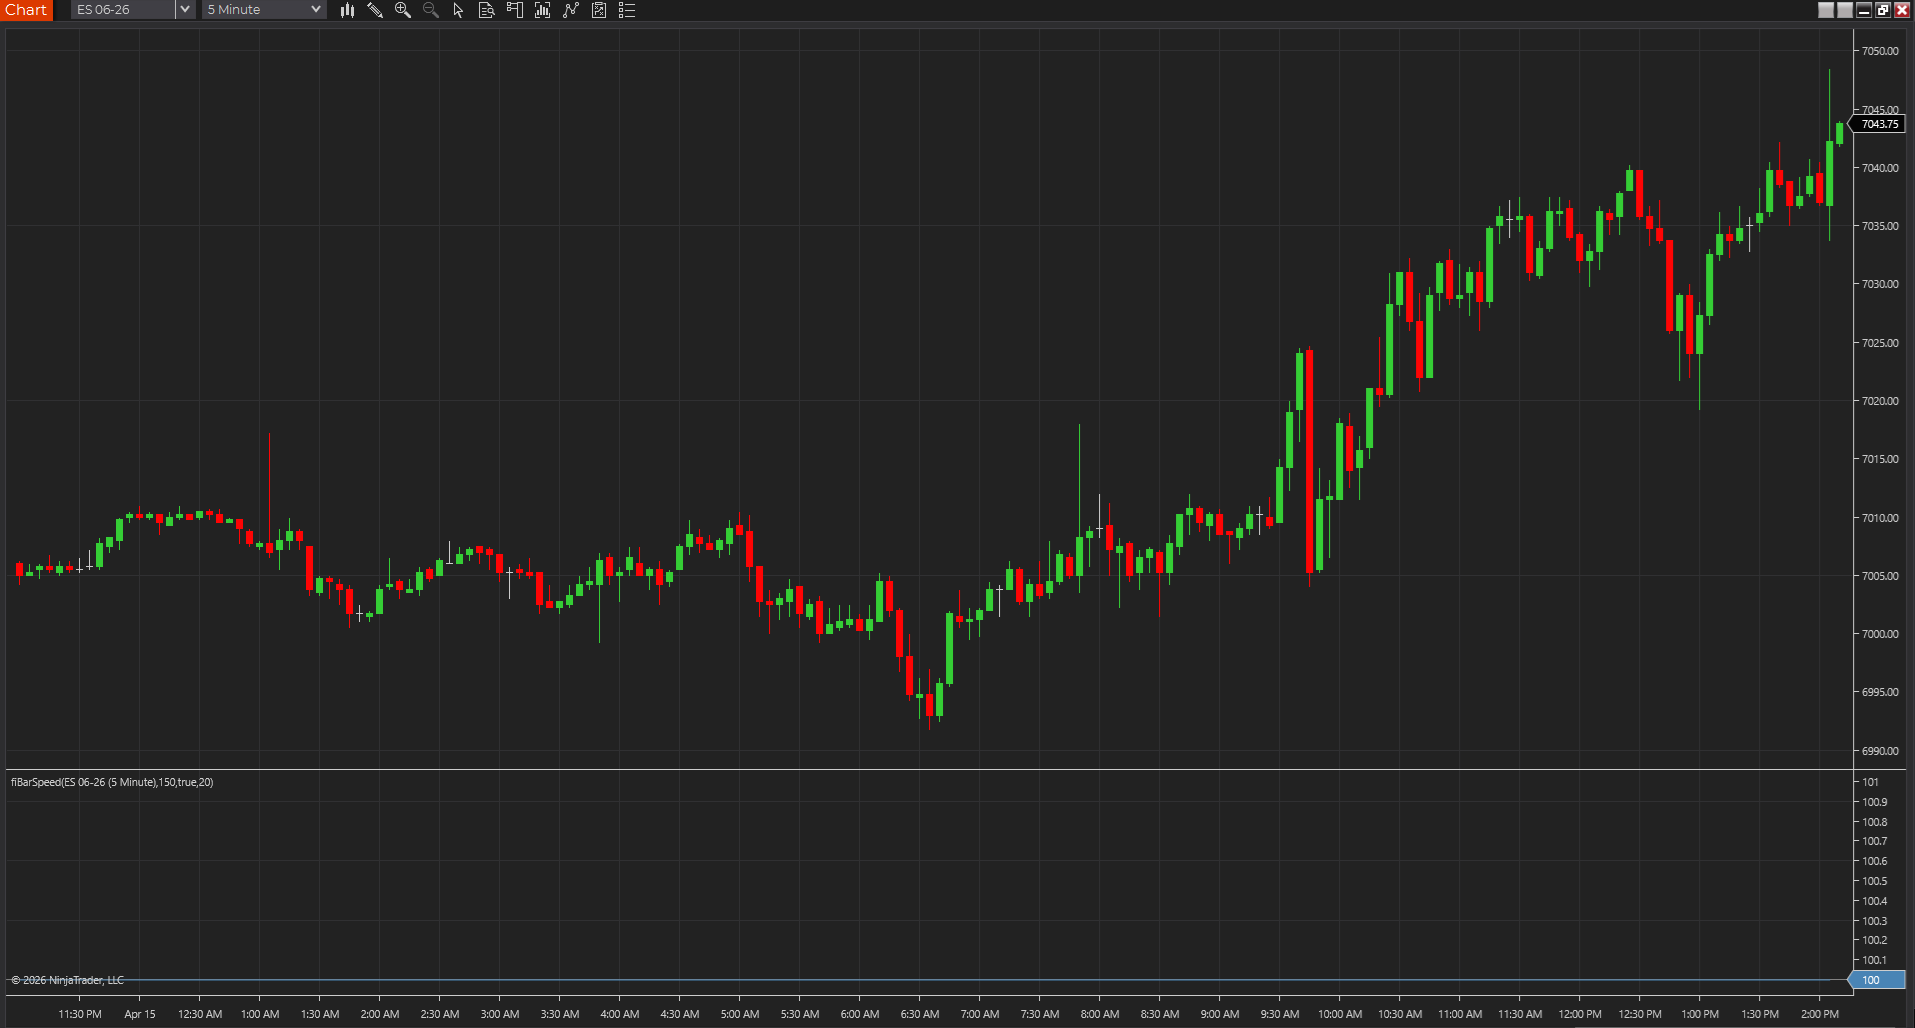
This chart capture shows the study on a real NinjaTrader workspace. Use it as visual reference, then confirm behavior on your own instrument, session, and timeframe.
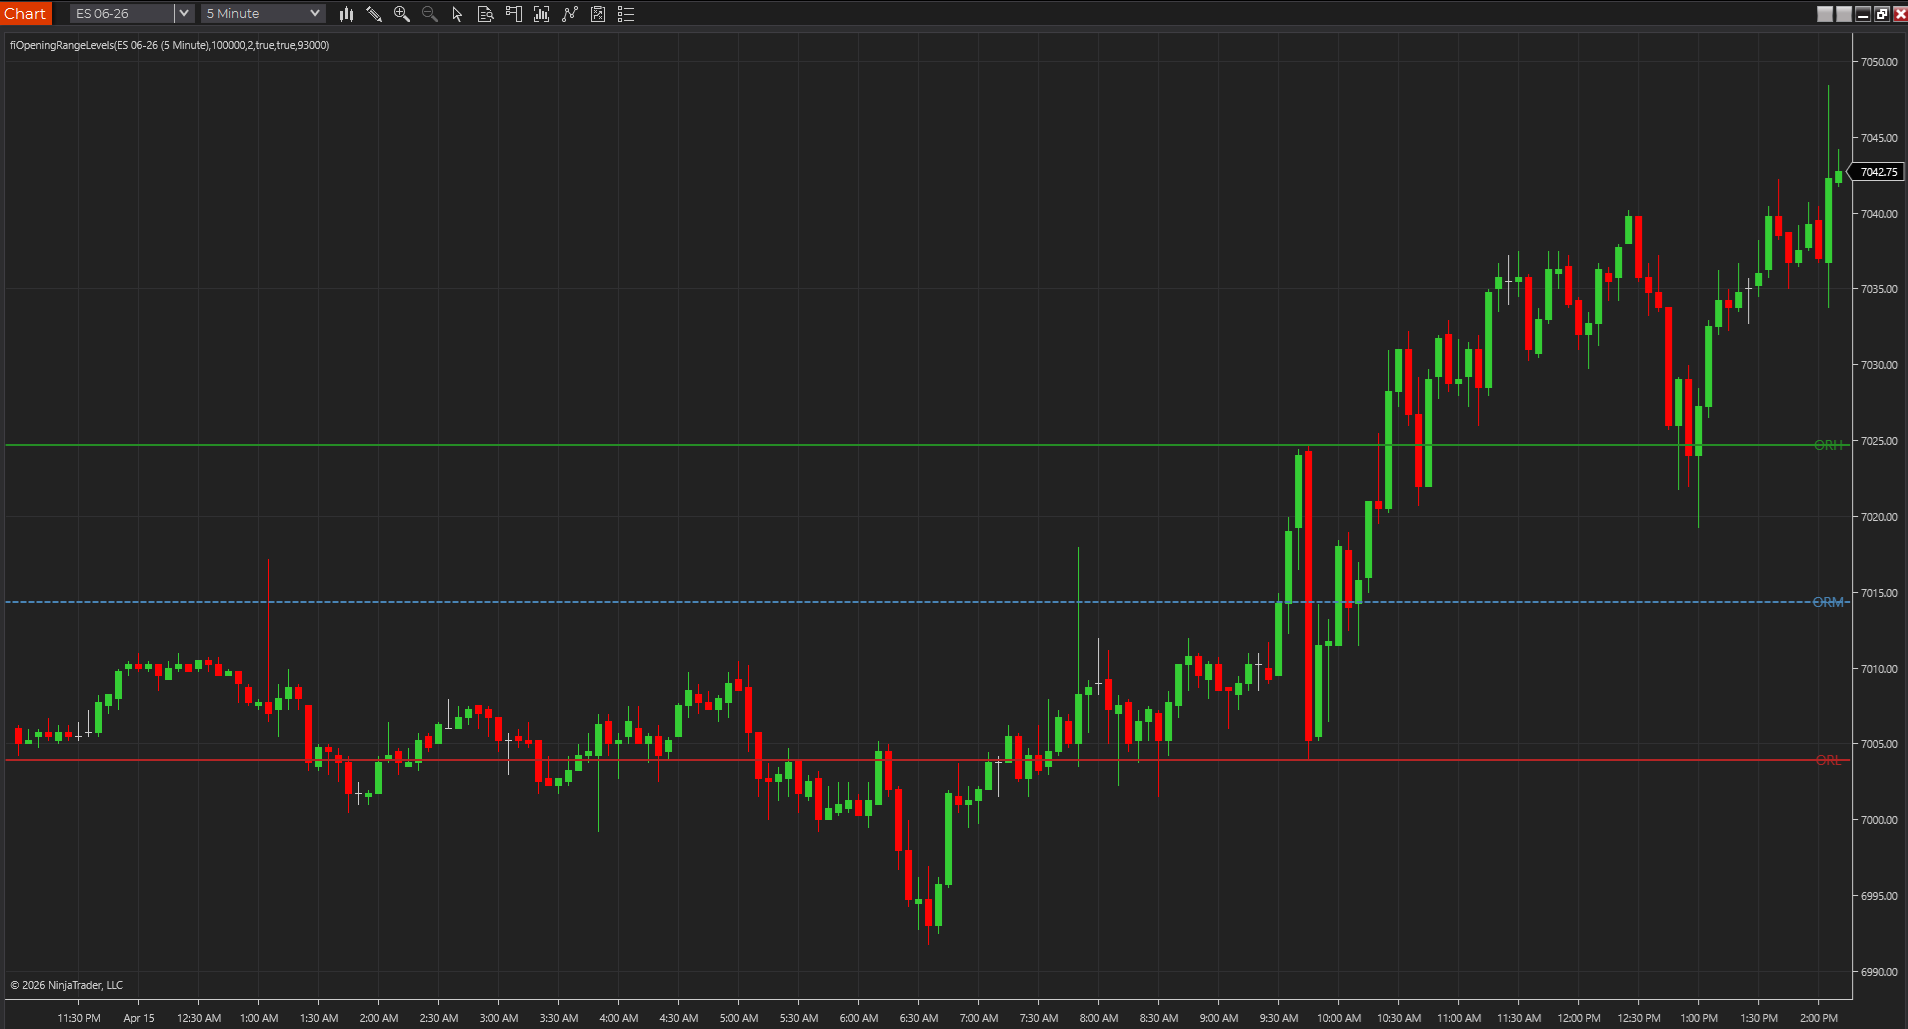
Opening range mapped on chart
A NinjaTrader 8 chart showing the opening range high, low, and midpoint held on screen for early-session context.
Best fit
- Defining the first-session balance area.
- Tracking reactions above or below the opening range.
- Comparing trend days against range-bound starts.
Before using it live
- Import the NinjaTrader 8 ZIP through NinjaTrader's normal import flow.
- Set the opening range start and end times to match the market.
- Confirm your chart timezone and session template before trusting the levels.
- Review how the tool behaves on your actual session template, chart type, and instrument.
Settings to review
Start time for the opening range window.
End time for the opening range window.
Toggles the midpoint line between opening range high and low.
Installation notes
- Import the NinjaTrader 8 ZIP through NinjaTrader's normal import flow.
- Set the opening range start and end times to match the market.
- Confirm your chart timezone and session template before trusting the levels.
Downloads
Source code
These source examples are provided for copy/paste workflows on other charting platforms. Review and test any script in a simulator before using it on a live chart.
{
  Opening Range Levels
  FreeIndicators.com source example.
  Works as a starting point for TradeStation EasyLanguage and MultiCharts PowerLanguage.
}

Inputs: StartTime(0930), EndTime(1000);
Vars: ORHigh(0), ORLow(0), Collecting(False);

If Date <> Date[1] Then Begin
  ORHigh = High;
  ORLow = Low;
  Collecting = False;
End;

If Time >= StartTime And Time <= EndTime Then Begin
  Collecting = True;
  ORHigh = MaxList(ORHigh, High);
  ORLow = MinList(ORLow, Low);
End;

If Collecting And Time > EndTime Then Begin
  Plot1(ORHigh, "ORH");
  Plot2(ORLow, "ORL");
  Plot3((ORHigh + ORLow) / 2, "ORM");
End;// Opening Range Levels
// FreeIndicators.com source example for MetaTrader 4.
#property indicator_chart_window
#property indicator_buffers 3
#property indicator_color1 DodgerBlue
#property indicator_color2 Crimson
#property indicator_color3 SeaGreen
double Buffer1[];
double Buffer2[];
double Buffer3[];
int init() {
SetIndexBuffer(0, Buffer1);
SetIndexBuffer(1, Buffer2);
SetIndexBuffer(2, Buffer3);
return(0);
}
int start() {
int counted = IndicatorCounted();
int limit = Bars - counted - 1;
int startTime = 93000, endTime = 100000;
double orHigh = 0, orLow = 0;
for(int i = limit; i >= 0; i--) {
int t = TimeHour(Time[i]) * 10000 + TimeMinute(Time[i]) * 100;
if(t >= startTime && t <= endTime) {
orHigh = MathMax(orHigh == 0 ? High[i] : orHigh, High[i]);
orLow = MathMin(orLow == 0 ? Low[i] : orLow, Low[i]);
}
Buffer1[i] = orHigh;
Buffer2[i] = orLow;
Buffer3[i] = (orHigh + orLow) / 2.0;
}
return(0);
}// Opening Range Levels
// FreeIndicators.com source example for MetaTrader 5.
#property indicator_chart_window
#property indicator_buffers 3
#property indicator_plots 3
double Buffer1[];
double Buffer2[];
double Buffer3[];
int OnInit() {
SetIndexBuffer(0, Buffer1, INDICATOR_DATA);
SetIndexBuffer(1, Buffer2, INDICATOR_DATA);
SetIndexBuffer(2, Buffer3, INDICATOR_DATA);
return(INIT_SUCCEEDED);
}
int OnCalculate(const int rates_total,
const int prev_calculated,
const datetime &time[],
const double &open[],
const double &high[],
const double &low[],
const double &close[],
const long &tick_volume[],
const long &volume[],
const int &spread[]) {
int start = prev_calculated > 1 ? prev_calculated - 1 : 1;
int startTime = 93000, endTime = 100000;
double orHigh = 0, orLow = 0;
for(int i = start; i < rates_total; i++) {
MqlDateTime dt; TimeToStruct(time[i], dt);
int t = dt.hour * 10000 + dt.min * 100;
if(t >= startTime && t <= endTime) {
orHigh = MathMax(orHigh == 0 ? high[i] : orHigh, high[i]);
orLow = MathMin(orLow == 0 ? low[i] : orLow, low[i]);
}
Buffer1[i] = orHigh;
Buffer2[i] = orLow;
Buffer3[i] = (orHigh + orLow) / 2.0;
}
return(rates_total);
}//@version=5
indicator("Opening Range Levels", overlay=true)
startHour = input.int(9, "Start hour")
startMinute = input.int(30, "Start minute")
endHour = input.int(10, "End hour")
endMinute = input.int(0, "End minute")
inRange = (hour > startHour or hour == startHour and minute >= startMinute) and (hour < endHour or hour == endHour and minute <= endMinute)
newDay = ta.change(time("D"))
var float orHigh = na
var float orLow = na
orHigh := newDay ? na : inRange ? math.max(nz(orHigh, high), high) : orHigh
orLow := newDay ? na : inRange ? math.min(nz(orLow, low), low) : orLow
plot(orHigh, "OR High", color=color.green)
plot(orLow, "OR Low", color=color.red)
plot((orHigh + orLow) / 2, "OR Mid", color=color.blue)Limitations
- Different markets need different opening windows.
- The NT8 version draws reference levels only; it does not fire alerts or place trades.
- A reference level does not define risk by itself.
Frequently asked questions
Does it repaint?
This indicator is designed as a chart reference tool, not as a hindsight-only backfitted signal. Even so, you should still test it bar by bar on your chart type to confirm how it behaves on the active bar.
Which platforms are covered?
NinjaTrader 8, TradeStation EasyLanguage, MultiCharts PowerLanguage, MetaTrader 4, MetaTrader 5, TradingView Pine Script are currently represented through downloads or source pages.
Is source code included?
Yes. This page includes source examples or links to platform-specific source pages where applicable.