Guide walkthrough
Start reading here
This is the main article body, where the page shifts from summary cards into the actual workflow and decision-making notes.
On this page
Key terms for this guide
These glossary pages cover the ideas and platform language most likely to matter as you work through this guide.
MultiCharts rewards studies that stay honest across chart settings
The best MultiCharts indicators are usually not the loudest ones. They are the studies that still make sense after you change session settings, bar type, or data series. If the indicator depends on clean chart structure and transparent logic, MultiCharts tends to handle it well.
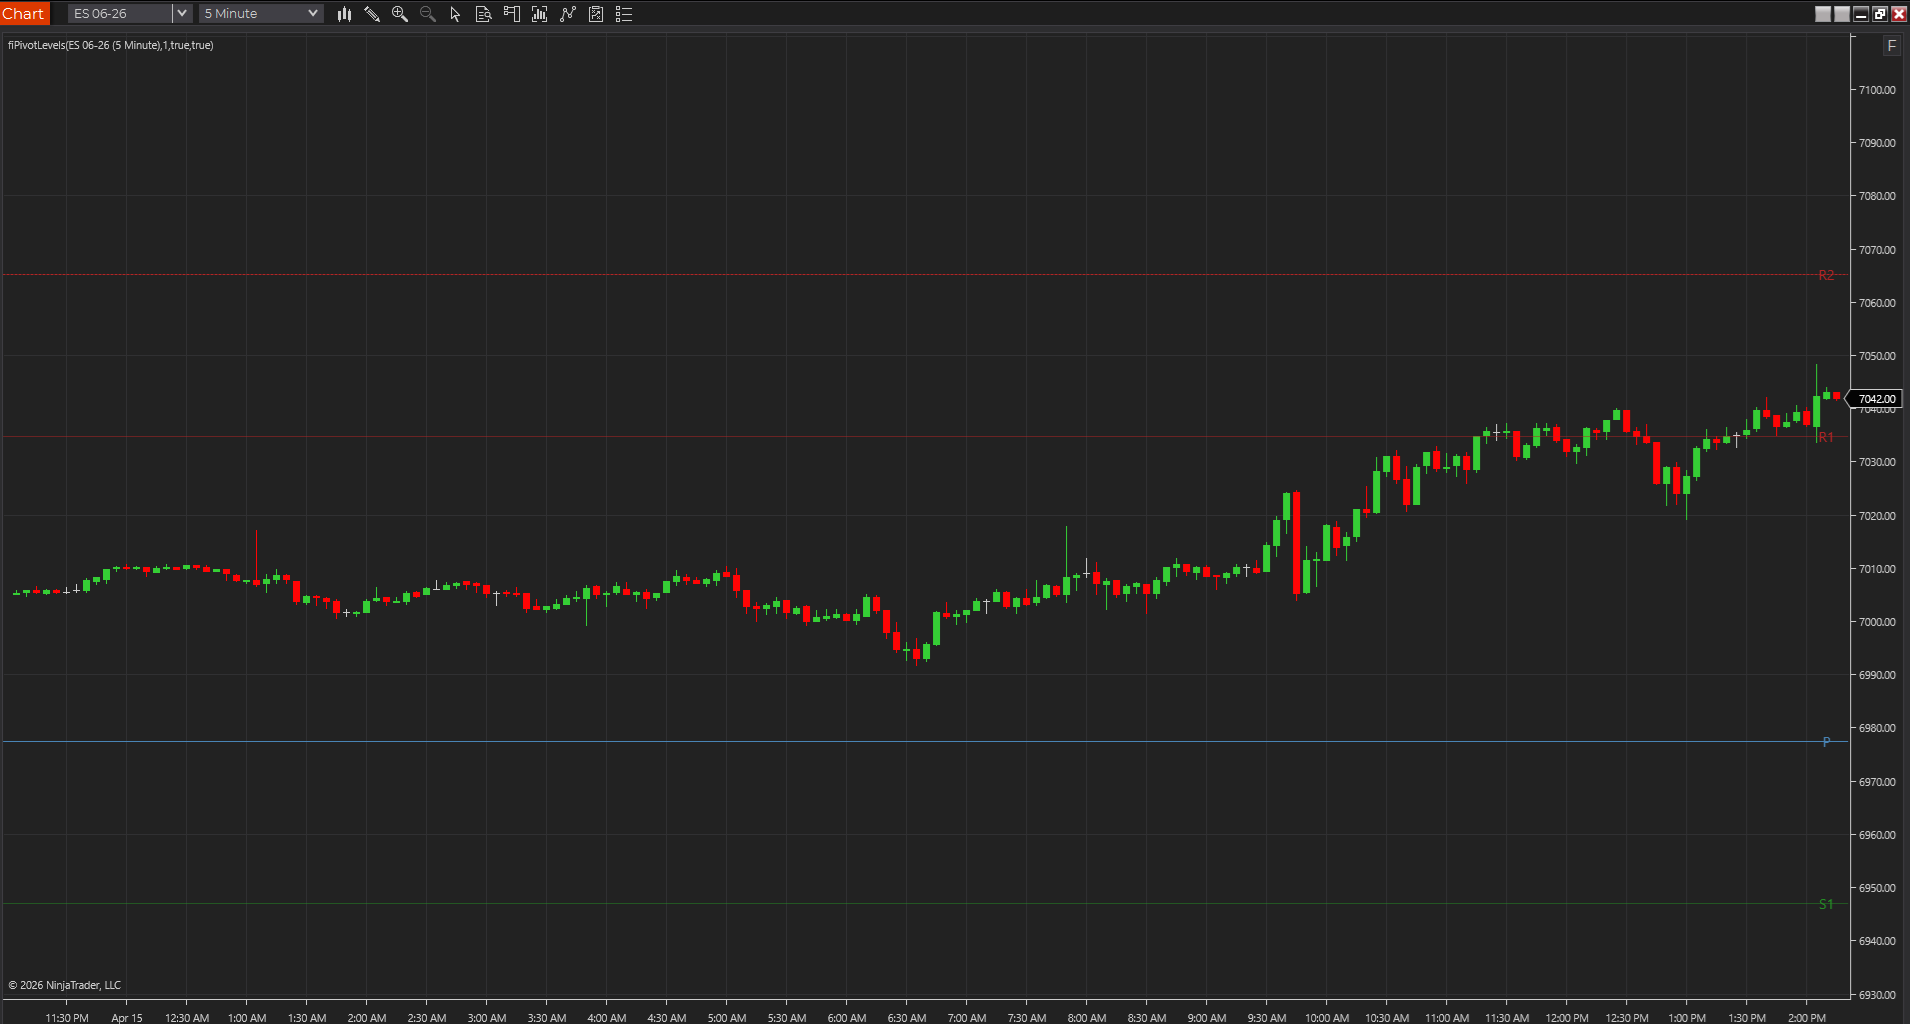
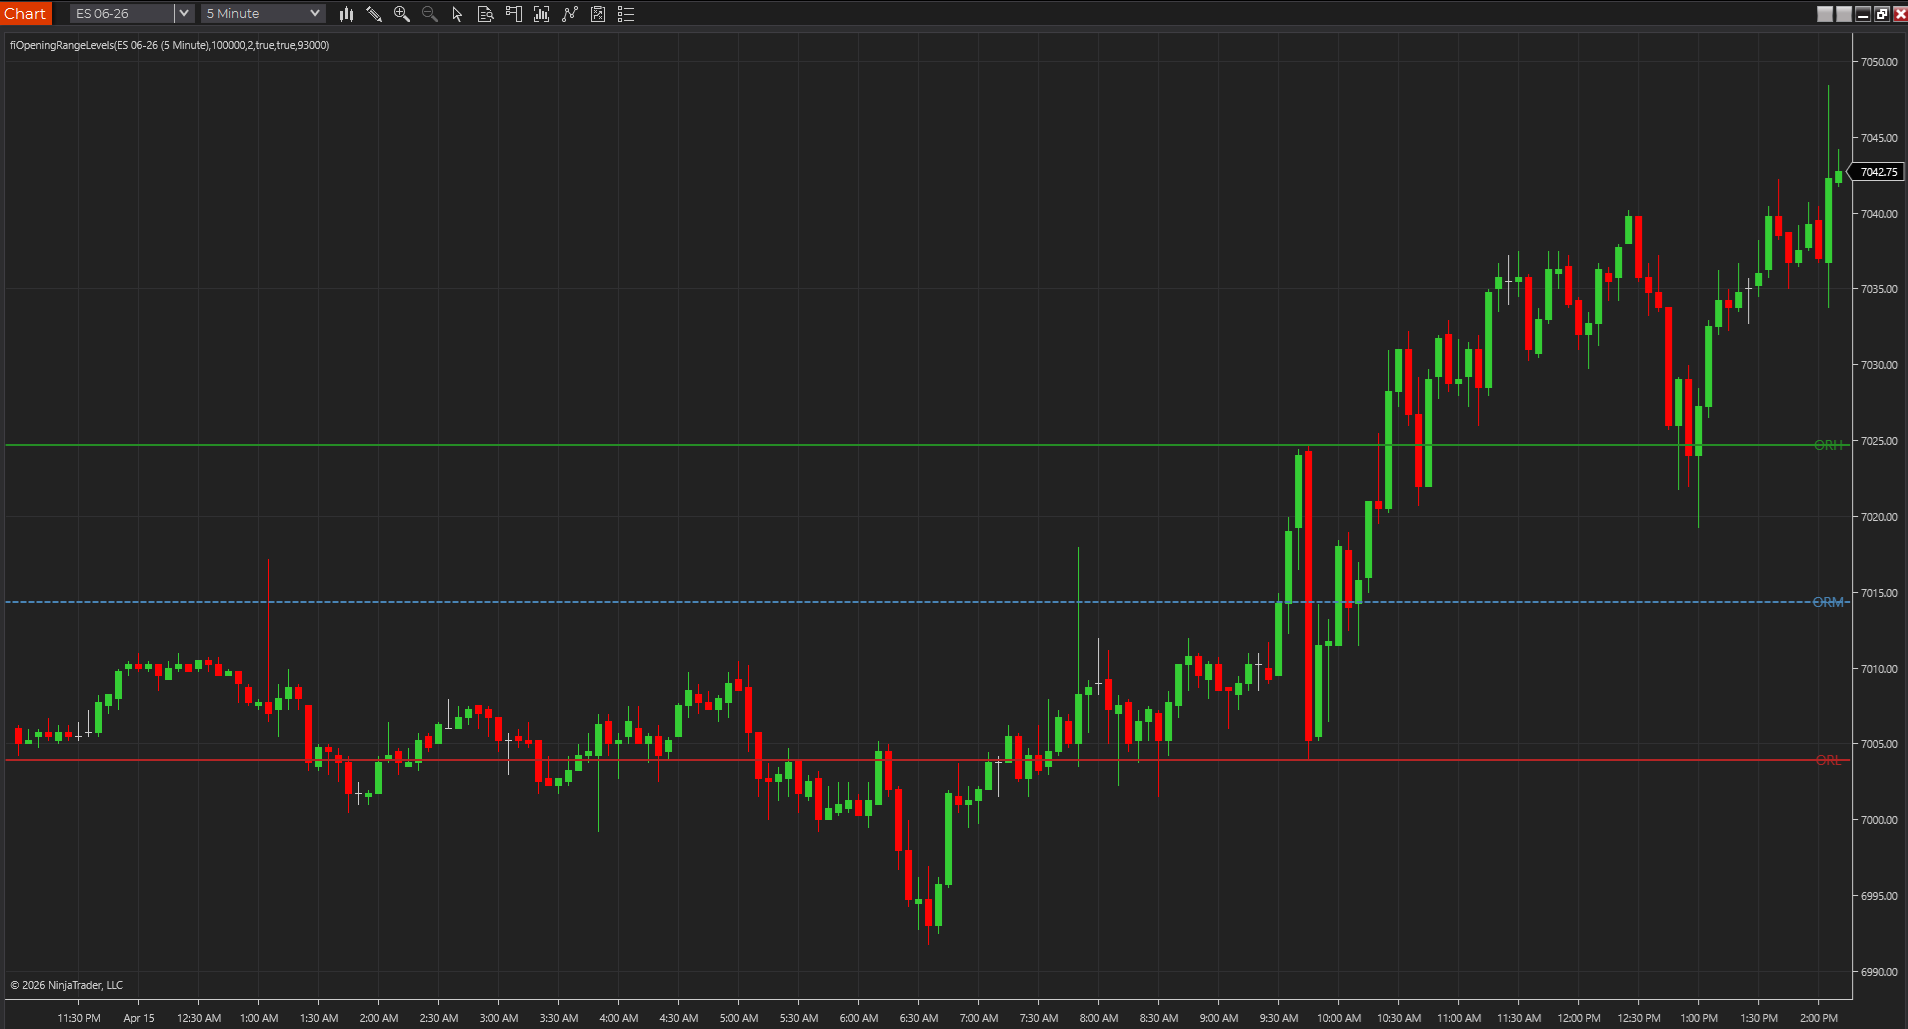
- Session, pivot, and opening-range tools are strong because you can verify the math directly on the chart.
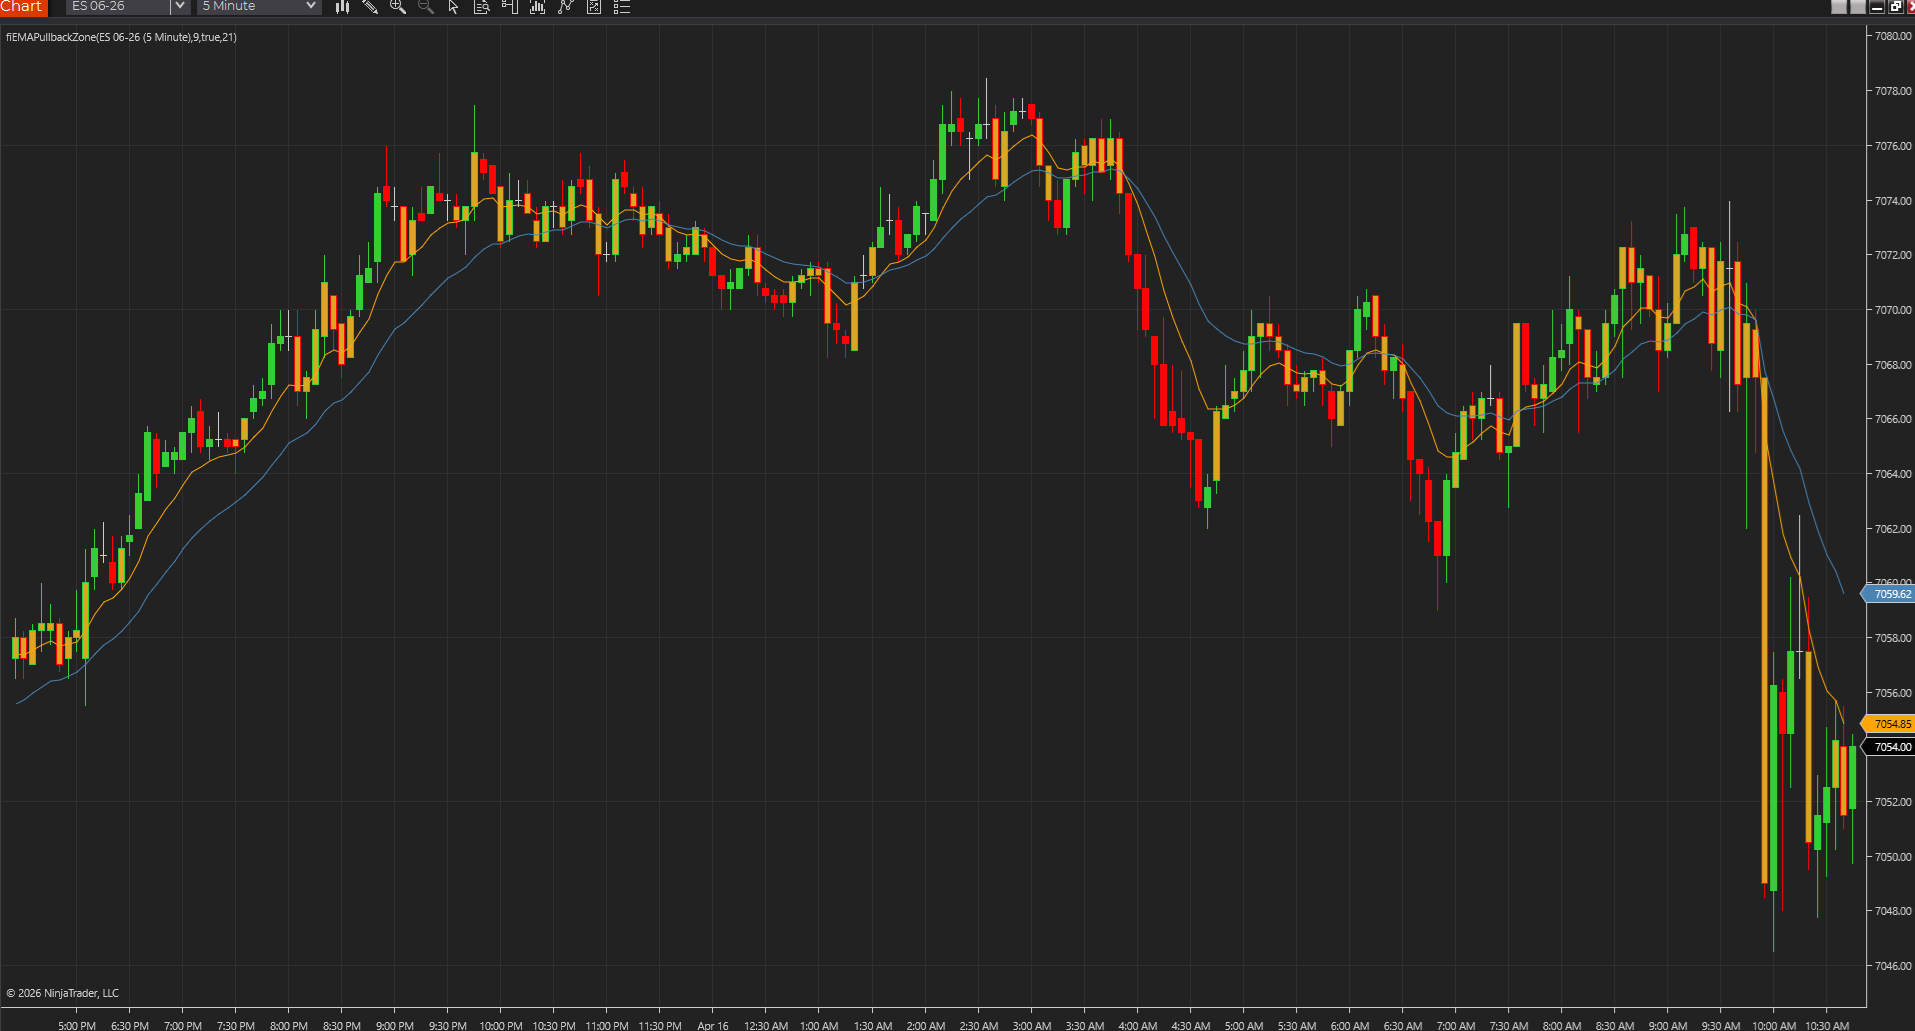
- Trend and pullback studies work best when they stay readable and do not over-annotate price.
- The quiet study that survives testing is usually better than the clever one that only looks good once.
PowerLanguage-friendly tools age better because they are easier to port and maintain
One of MultiCharts' biggest practical advantages is how often readable studies can be edited, compared, and maintained without starting over. A tool that compiles cleanly in PowerLanguage Editor and exposes sensible inputs is much more valuable than a study that works once and becomes a mystery immediately after.
- Readable scripts are easier to compare against TradeStation-style EasyLanguage versions.
- Simple tools make it easier to document changes after a port.
- That matters when the indicator is part of a real workflow instead of a one-off experiment.
Level, breakout, and trend-context studies are usually the best first layer
MultiCharts tends to shine with studies that answer obvious chart questions cleanly: where are the important levels, did the opening range break, is the pullback still valid, and is the trend context intact. Those are better first additions than loading a stack of decorative studies that explain the same move three different ways.
- Choose level tools when location matters more than speed.
- Choose breakout tools when the session structure actually supports a range expansion trade.
- Choose trend tools when continuation quality matters more than exact entry timing.
A good MultiCharts study should be easy to verify after compile
The fastest test for a MultiCharts indicator is simple: after compile, can you drop it on one chart, confirm the plots, and explain why the output is where it is? If yes, it is probably a good fit. If not, the study may be too opaque or too fragile for daily use.
- The best study exposes the inputs that matter without hiding the logic.
- You should be able to sanity-check a few bars manually after compile.
- That kind of transparency is what makes a PowerLanguage tool worth keeping.
The strongest MultiCharts tools survive small environment changes
One of the best ways to judge a MultiCharts indicator is to make a small change to the environment and see whether the study still makes sense. If session settings, bar choices, or normal chart adjustments immediately turn the output into a mystery, the study may be too fragile to trust. The better tools keep their story intact even when the chart is not frozen in perfect conditions.
- A durable study should survive ordinary chart maintenance.
- Small environment changes are a practical honesty test.
- That is often where reliable PowerLanguage tools stand out.
Best next reads
These pages pick up the questions most readers usually have next, so you do not have to back out and start a fresh search.
Frequently asked questions
What makes a good MultiCharts indicator?
Usually it is a script that compiles cleanly in PowerLanguage Editor, solves one clear chart problem, and still makes sense after you test it on the session and bar type you actually trade.
Is MultiCharts better with breakout indicators or level indicators?
Level indicators usually make the stronger base because they are easier to verify. Breakout indicators become more useful once session structure and chart settings are already under control.
What is a quick way to tell if a MultiCharts indicator is too fragile?
Make one normal chart change and see whether the study still makes sense. If a small session or bar-setting adjustment makes the output hard to explain, the tool may be too sensitive for daily use.