Guide walkthrough
Start reading here
This is the main article body, where the page shifts from summary cards into the actual workflow and decision-making notes.
On this page
Key terms for this guide
These glossary pages cover the ideas and platform language most likely to matter as you work through this guide.
Use PowerLanguage Editor as the real import point
For most pages on this site, the real MultiCharts entry point is PowerLanguage Editor. Create a new study there, paste the source, save it, and compile it. MultiCharts can import packaged studies, but these pages are usually about source you can verify and edit, not black-box files.
- Think create, paste, compile, and test instead of one-click install.
- Choose the right study type up front: Indicator, Signal, or Function.
- PowerLanguage is close to EasyLanguage, but you should still expect small edits.
Make sure the study assumptions match the chart
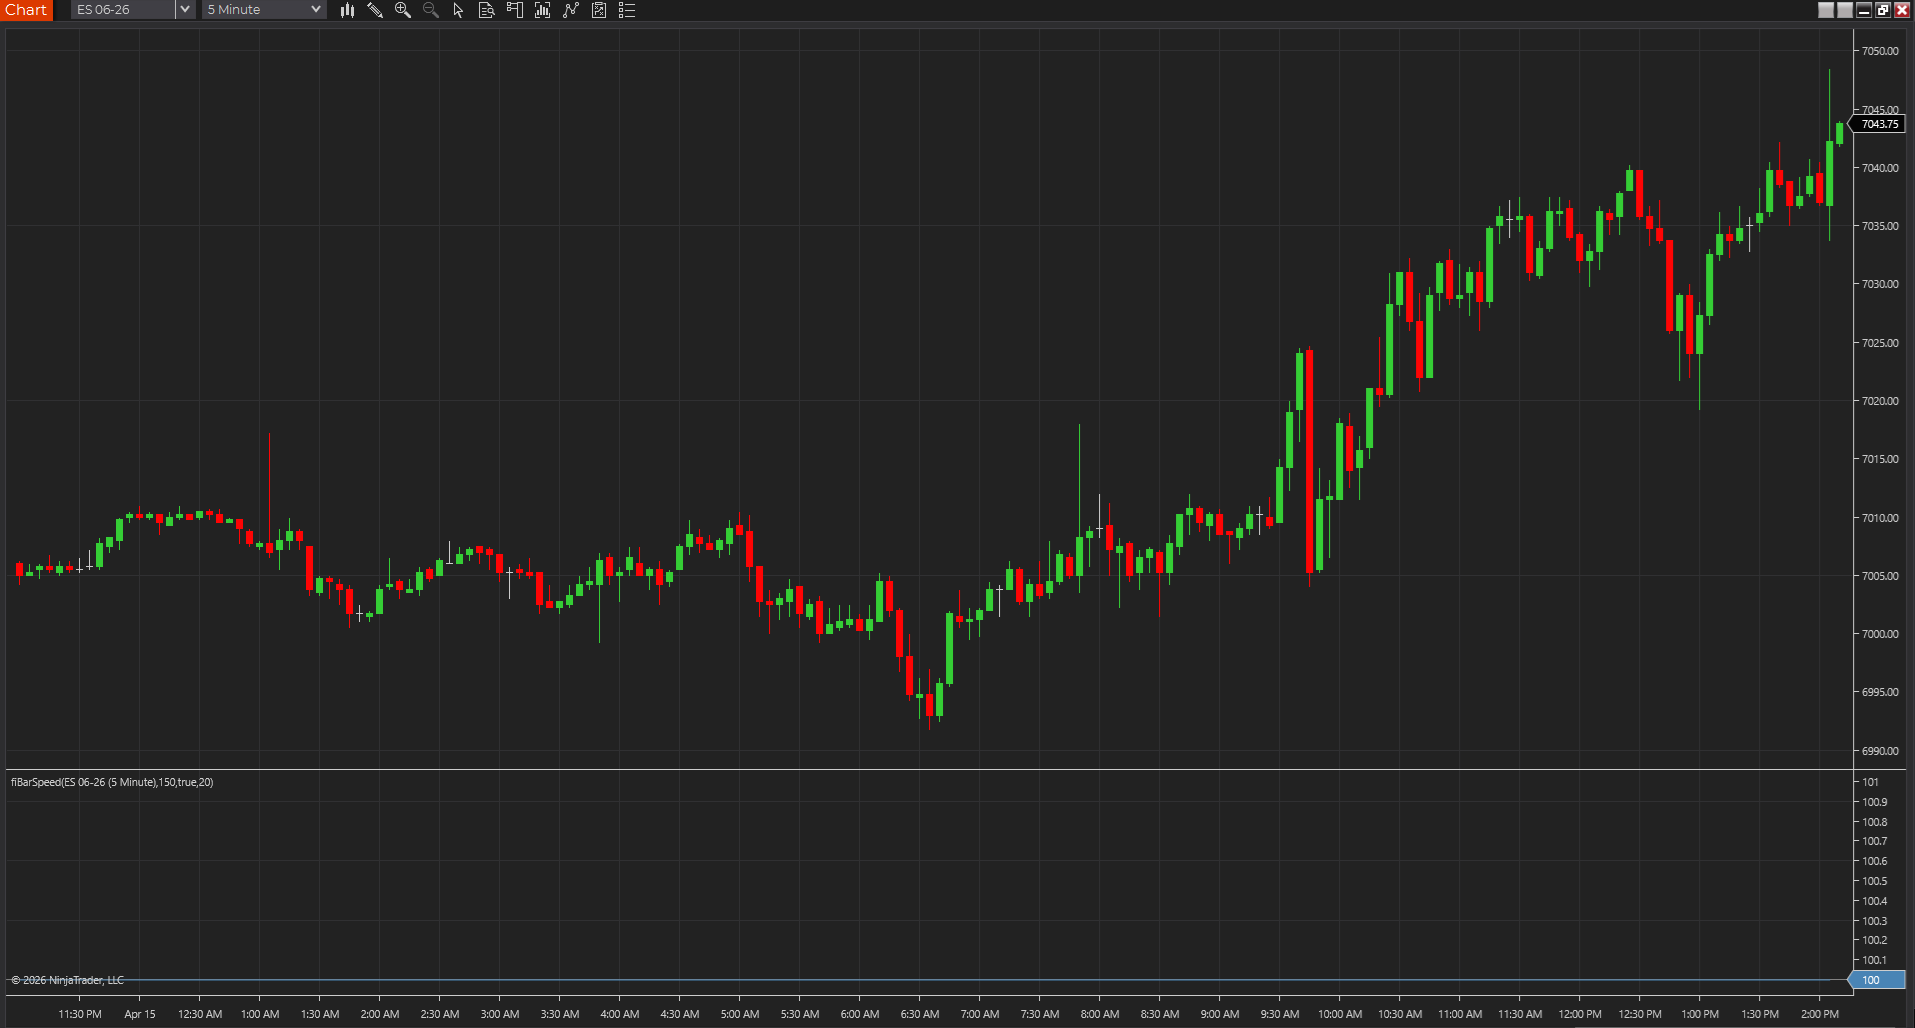
A MultiCharts study can compile and still appear wrong if the chart setup does not match what the script expects. Session-based levels need the right session template. Multi-data logic needs the correct extra data series. Faster studies can feel completely different on time bars versus range or tick bars.
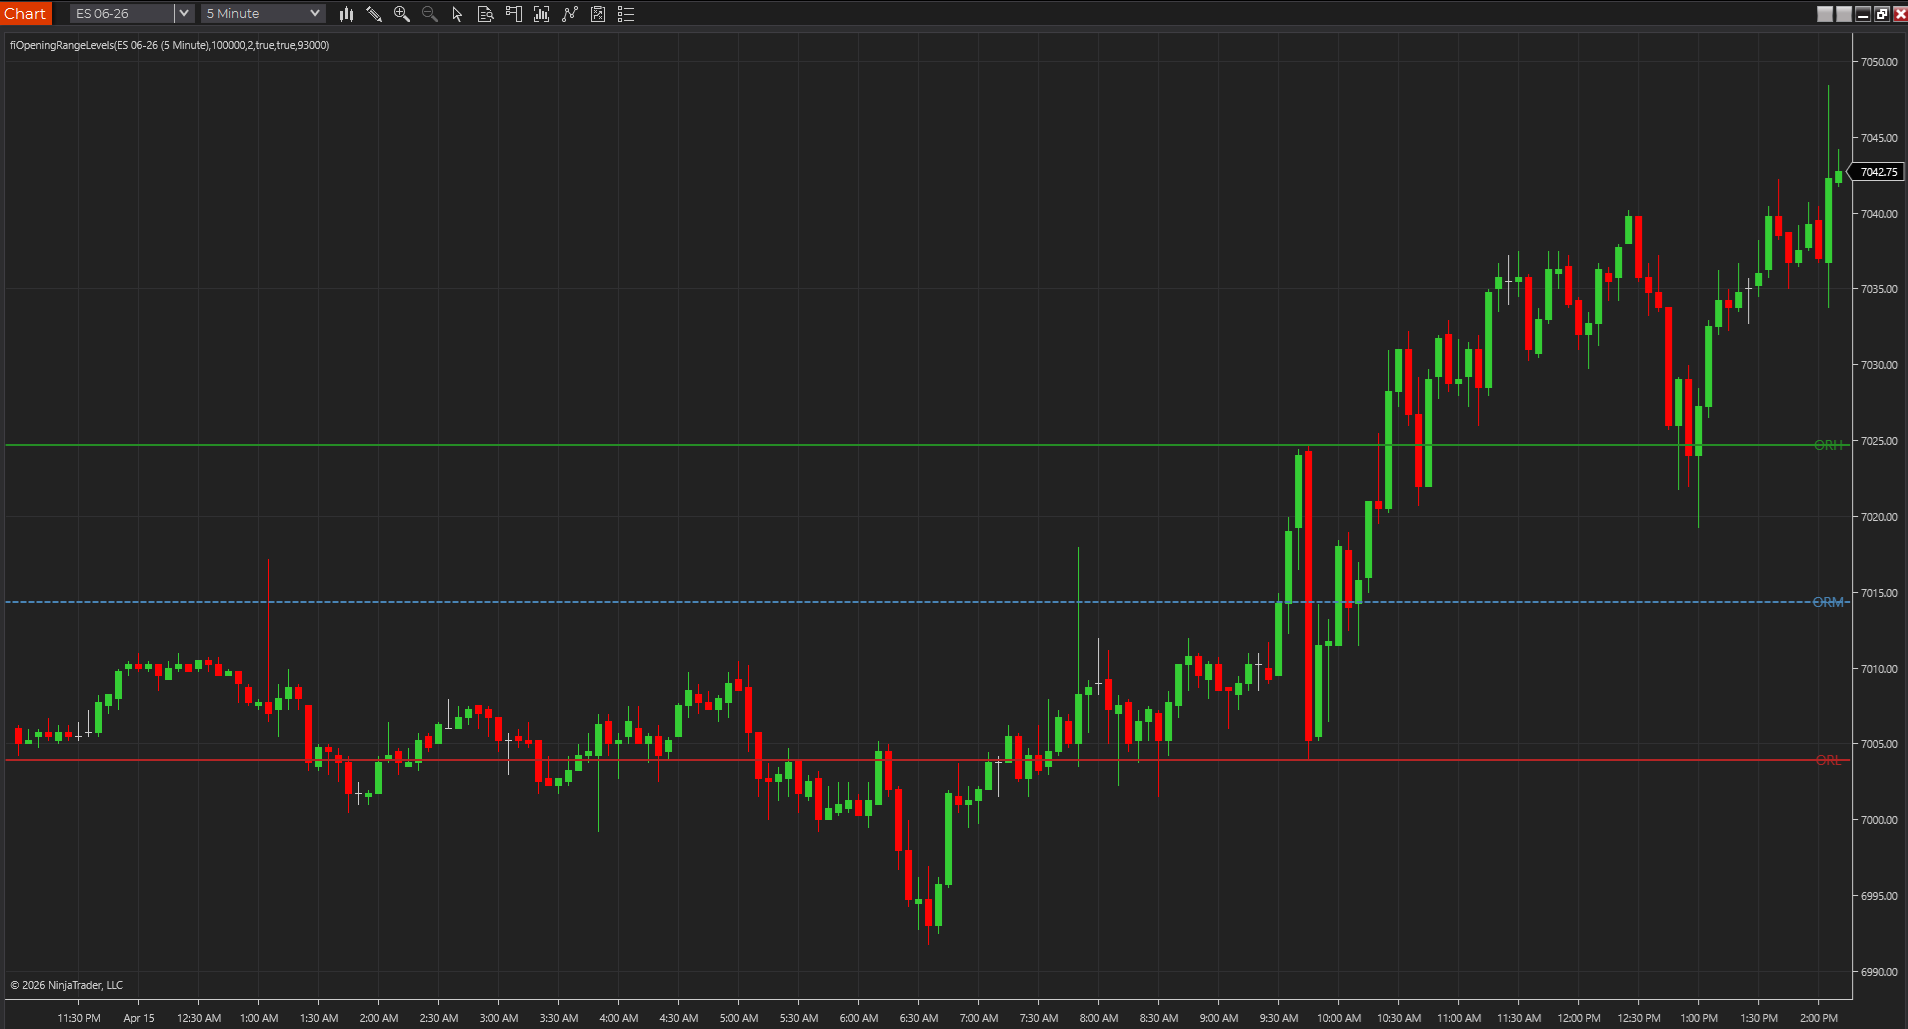
- Opening-range and session-level tools should be tested on the session you actually trade.
- If the script references another data stream, add it before calling the result broken.
- Do not judge the output on a random chart template with unknown settings.
Compile first, then load one chart and recalculate deliberately
After the source compiles in PowerLanguage Editor, add the study to one plain chart and force a clean recalculation if needed. You want to confirm the plot location, pane behavior, inputs, and basic math before the study disappears into a larger workspace.
- One chart is better than a noisy workspace during early verification.
- Use the study format dialog to confirm the inputs and visual settings exposed correctly.
- Change one variable at a time so you know what actually fixed the result.
Document your platform-specific edits
If the source started as TradeStation-style EasyLanguage and you make a MultiCharts-specific fix, keep a short note. Most ports between EasyLanguage and PowerLanguage are close enough that the edits feel minor, which is exactly why they are easy to forget when you revisit the file later.
- A short note now saves reverse-engineering later.
- Function substitutions and small syntax changes matter when you revisit the code.
- The goal is a repeatable compile path, not one lucky pass.
The first good import should make later imports easier
A solid MultiCharts import does more than get one study onto one chart. It gives you a workflow you can repeat with the next script without relearning the platform every time. That is why it helps to treat the first import like a template for later compile, chart-check, and troubleshooting work.
- A repeatable path matters more than one successful compile.
- Simple notes on study type and chart assumptions save time later.
- That makes the install guide useful beyond a single study.
Frequently asked questions
Are MultiCharts pages on this site downloadable packages?
Usually no. They are mainly source-first PowerLanguage examples, so the normal path is create the study in PowerLanguage Editor, compile it, and then test it on a chart.
Can I paste TradeStation code directly into MultiCharts?
Often you can get close, but you should still compile and review it in PowerLanguage Editor because built-ins, chart assumptions, and small platform behaviors can differ even when the syntax looks familiar.
What is the fastest way to tell whether a MultiCharts import is really usable?
Put it on one plain chart and make sure you can explain the plots, inputs, and session assumptions without digging back through the source. If the chart behavior is still confusing there, the import is not really finished.