Guide walkthrough
Start reading here
This is the main article body, where the page shifts from summary cards into the actual workflow and decision-making notes.
On this page
Key terms for this guide
These glossary pages cover the ideas and platform language most likely to matter as you work through this guide.
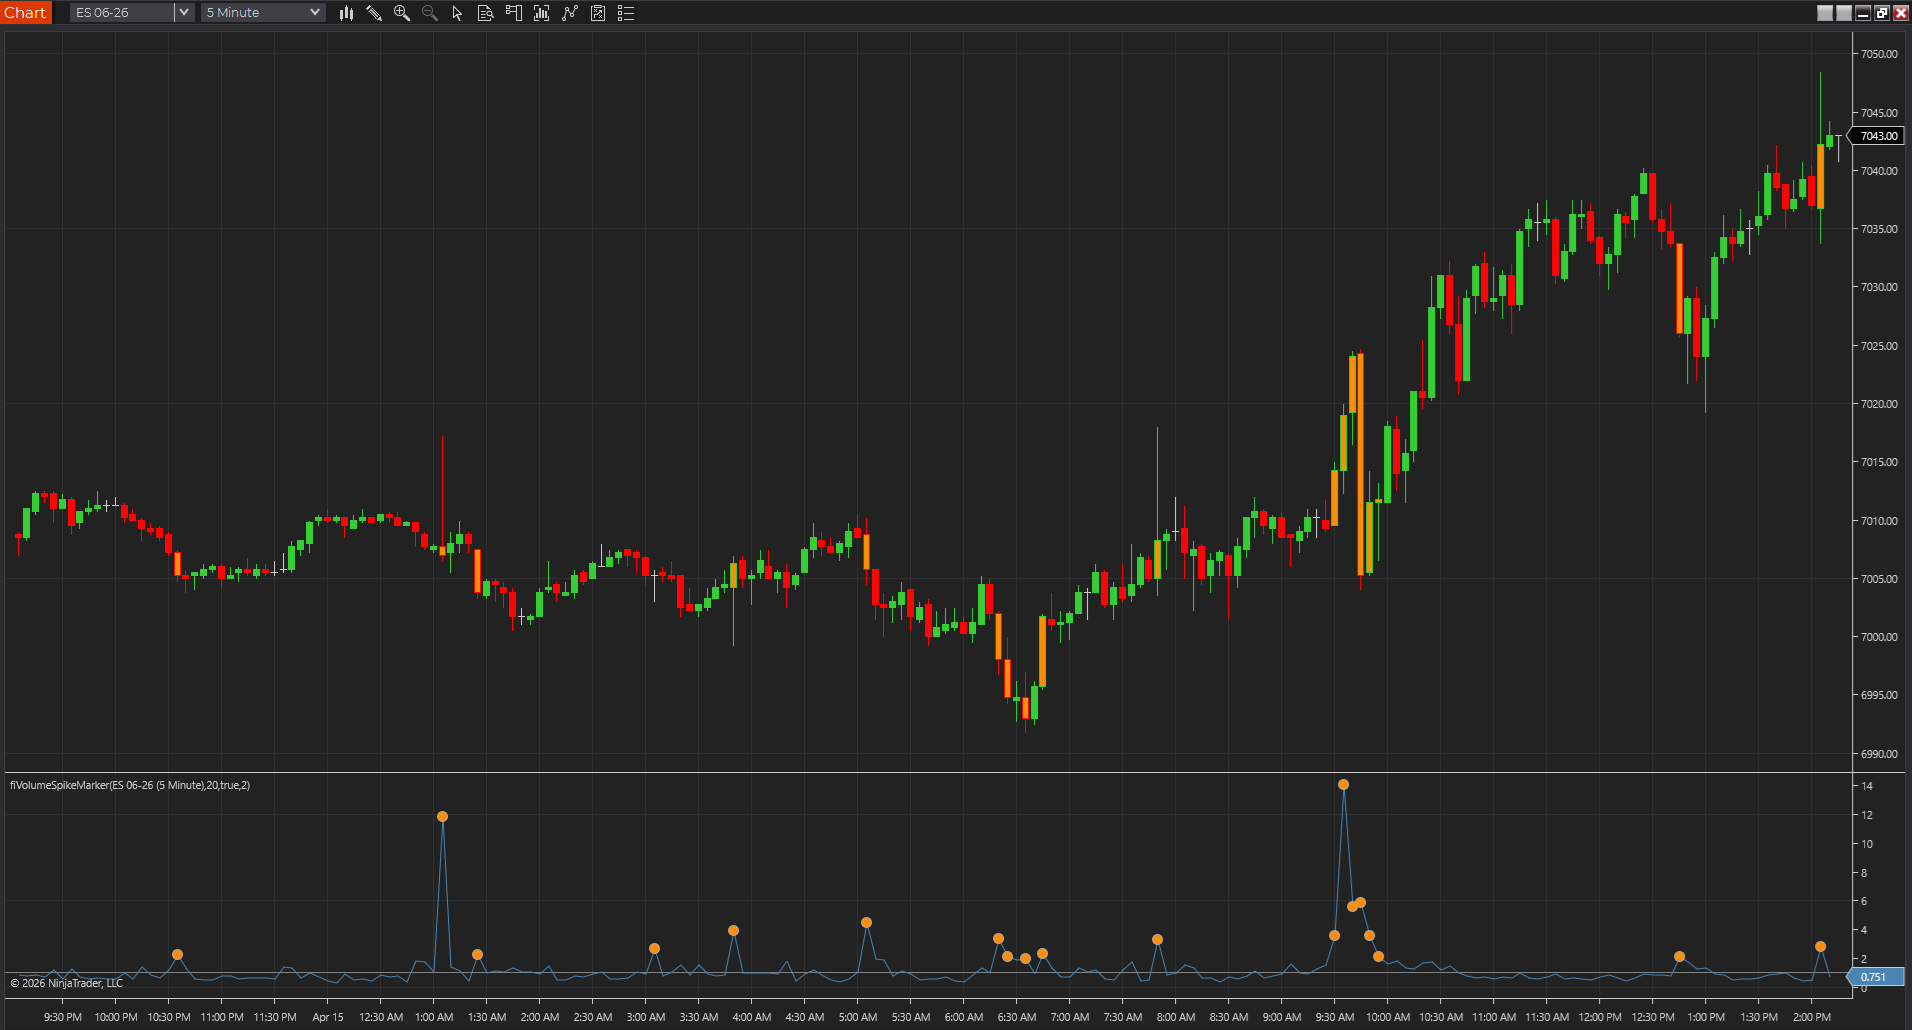
Participation matters most at important locations
Volume tools become more useful when price is testing an opening range boundary, prior-session level, or recent breakout edge. In the middle of a dull rotation, the same signal often matters less.
- Ask whether the move is building or losing participation.
- Ask whether the activity is happening at a meaningful location.
- Ask whether the information changes risk, timing, or patience.
Tempo matters too
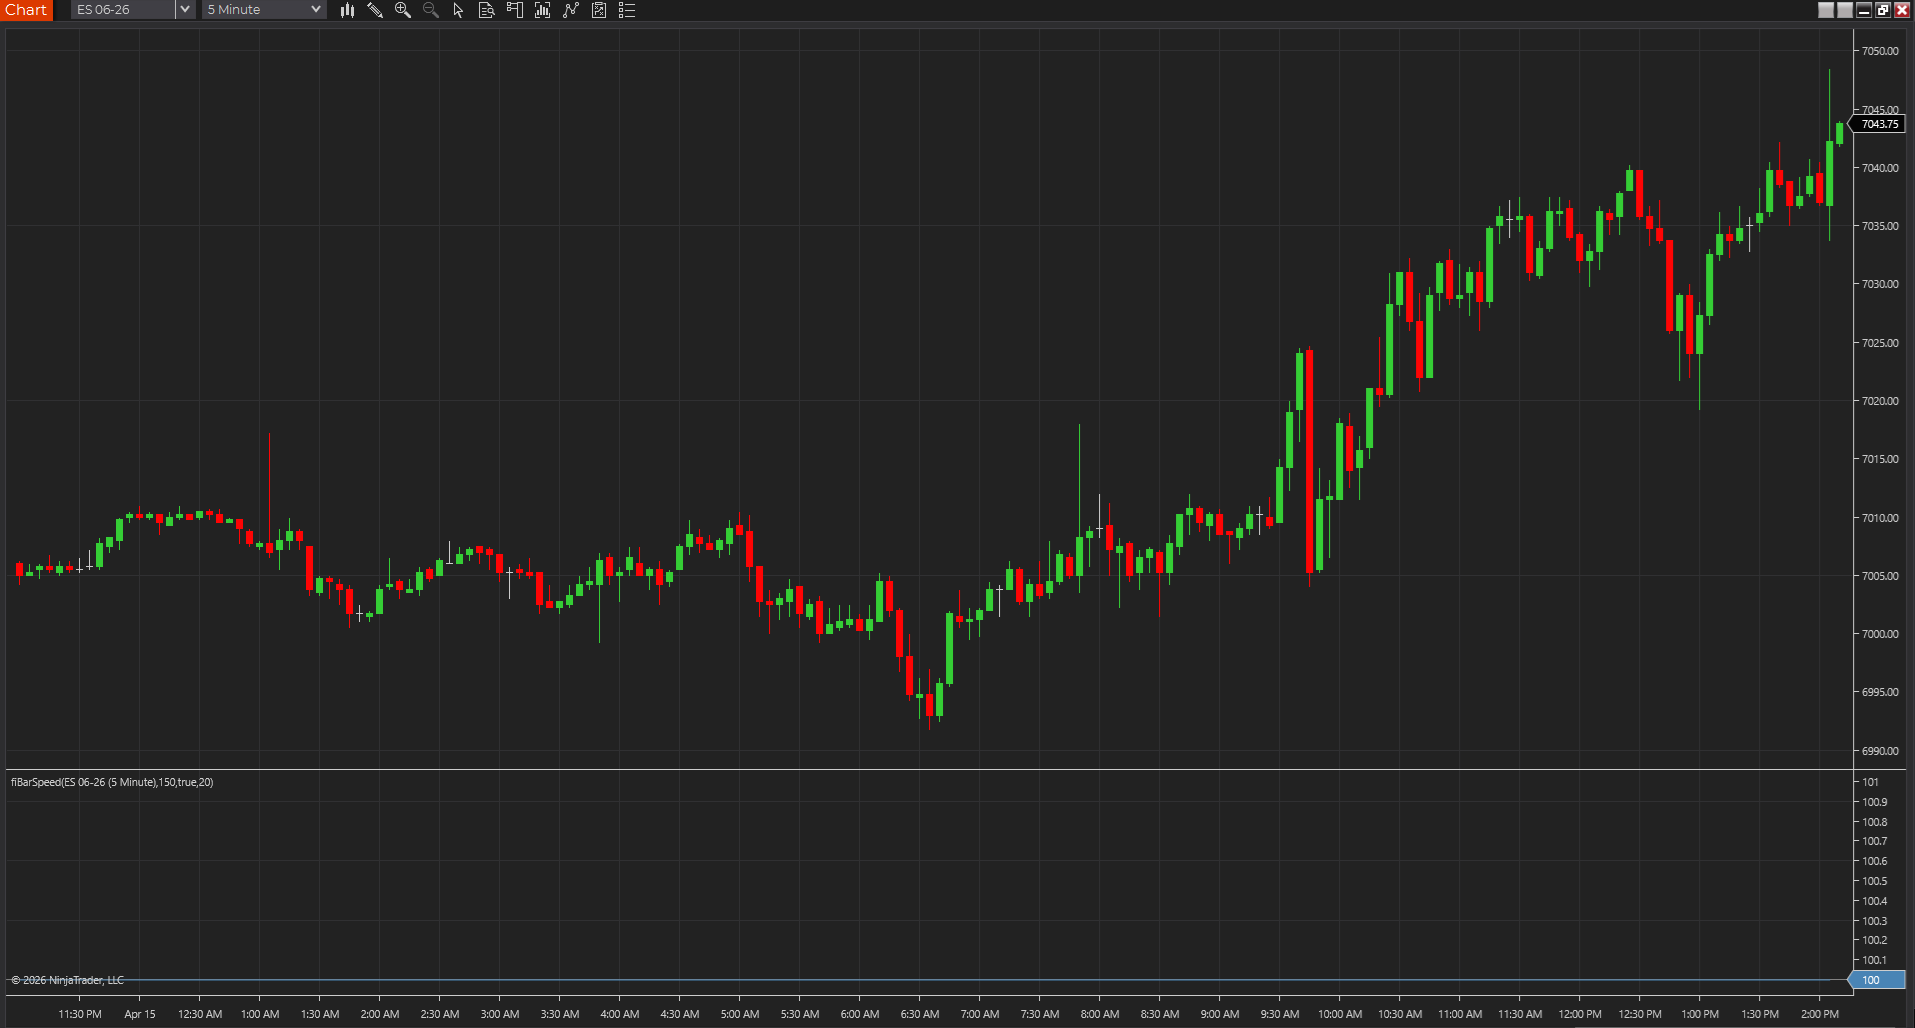
Not every chart tells the story through raw volume alone. On some chart types, bar speed or completion rate can show urgency earlier than a simple spike threshold.
- Fast bars can reveal urgency even before a raw volume threshold stands out.
- This is especially useful on active intraday charts.
- Tempo tools complement raw volume instead of replacing it.
Pair volume with location
Participation becomes much more useful when it happens at an opening range edge, prior-session level, or channel boundary. Context gives the burst meaning.
- A random spike in the middle of a rotation is often just noise.
- A spike at the edge of structure can change the whole read of the setup.
- This is why volume tools belong next to level and price-action tools.
Use the right market expectations
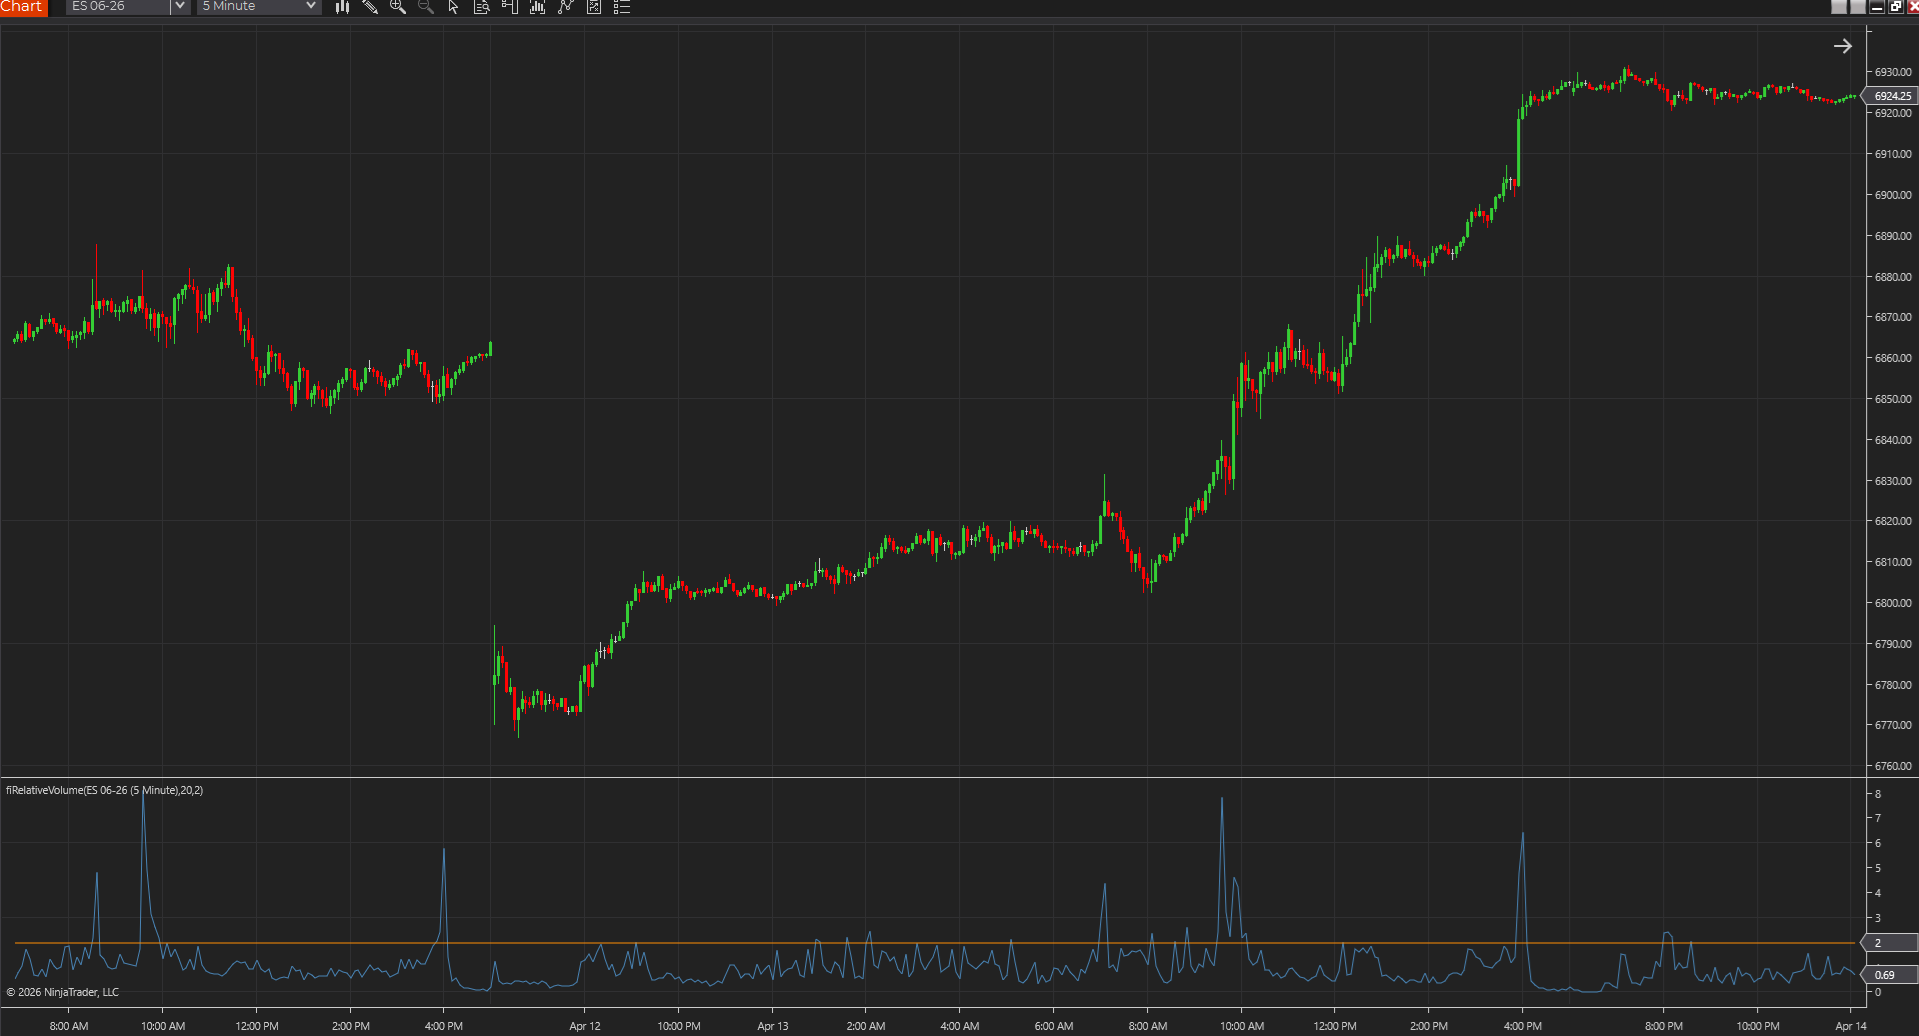
A centralized futures feed and a proxy-style forex feed do not give the same quality of volume context. Always judge the tool in light of the market and feed behind it.
- Futures often provide cleaner participation context.
- Forex volume proxies require more caution.
- Whenever the feed is weaker, confirmation from structure matters more.
Know the difference between volume and VWAP
VWAP uses volume, but it answers a different question from a spike marker or speed study. It gives a fair-value reference, not a direct measure of unusual activity.
- That is why VWAP often supports volume workflows instead of replacing them.
- A VWAP reclaim with rising participation is a stronger story than either signal alone.
- The comparison and support guides help sort out those relationships.
Start simple and test one threshold at a time
The easiest way to ruin a volume workflow is to add too many thresholds, colors, and secondary filters at once. Keep the study readable, then test one variable at a time.
- Start with a clean chart and a common instrument.
- Review the signals around session highs, lows, and breakout edges.
- If the tool only makes sense after heavy explanation, simplify.
Best next reads
These pages pick up the questions most readers usually have next, so you do not have to back out and start a fresh search.
Frequently asked questions
What is the difference between a volume spike tool and a bar speed tool?
A volume spike tool compares current participation to recent participation, while a bar speed tool measures how quickly bars are completing. They often complement each other.
Does a volume spike always mean a strong breakout?
No. It is stronger evidence when it happens at a meaningful chart location and price can actually continue from there.
Should VWAP be considered a volume indicator?
It uses volume, but it behaves more like a fair-value reference than a direct participation alarm. It belongs in the conversation, but not as a one-to-one replacement.