What it does
ATR Risk Bands draws a volatility envelope around price using an ATR length and multiplier. It is useful when you want a more realistic range reference than fixed-tick assumptions while judging expansion, pullback distance, or stop context.
Who this is for
This page is a good fit for traders who want a readable ATR Risk Bands workflow without having to reverse-engineer the setup from forum posts or screenshots.
Key terms for this tool
Review the core trading and platform terms tied to this page before changing settings or using the study in a live workspace.
What it is not
ATR Risk Bands is a chart-context tool. It does not place trades, manage risk automatically, or promise that a specific pattern will resolve in one direction. Use it to organize decisions, not to outsource them.
Chart examples
This chart capture shows the study on a real NinjaTrader workspace. Use it as visual reference, then confirm behavior on your own instrument, session, and timeframe.
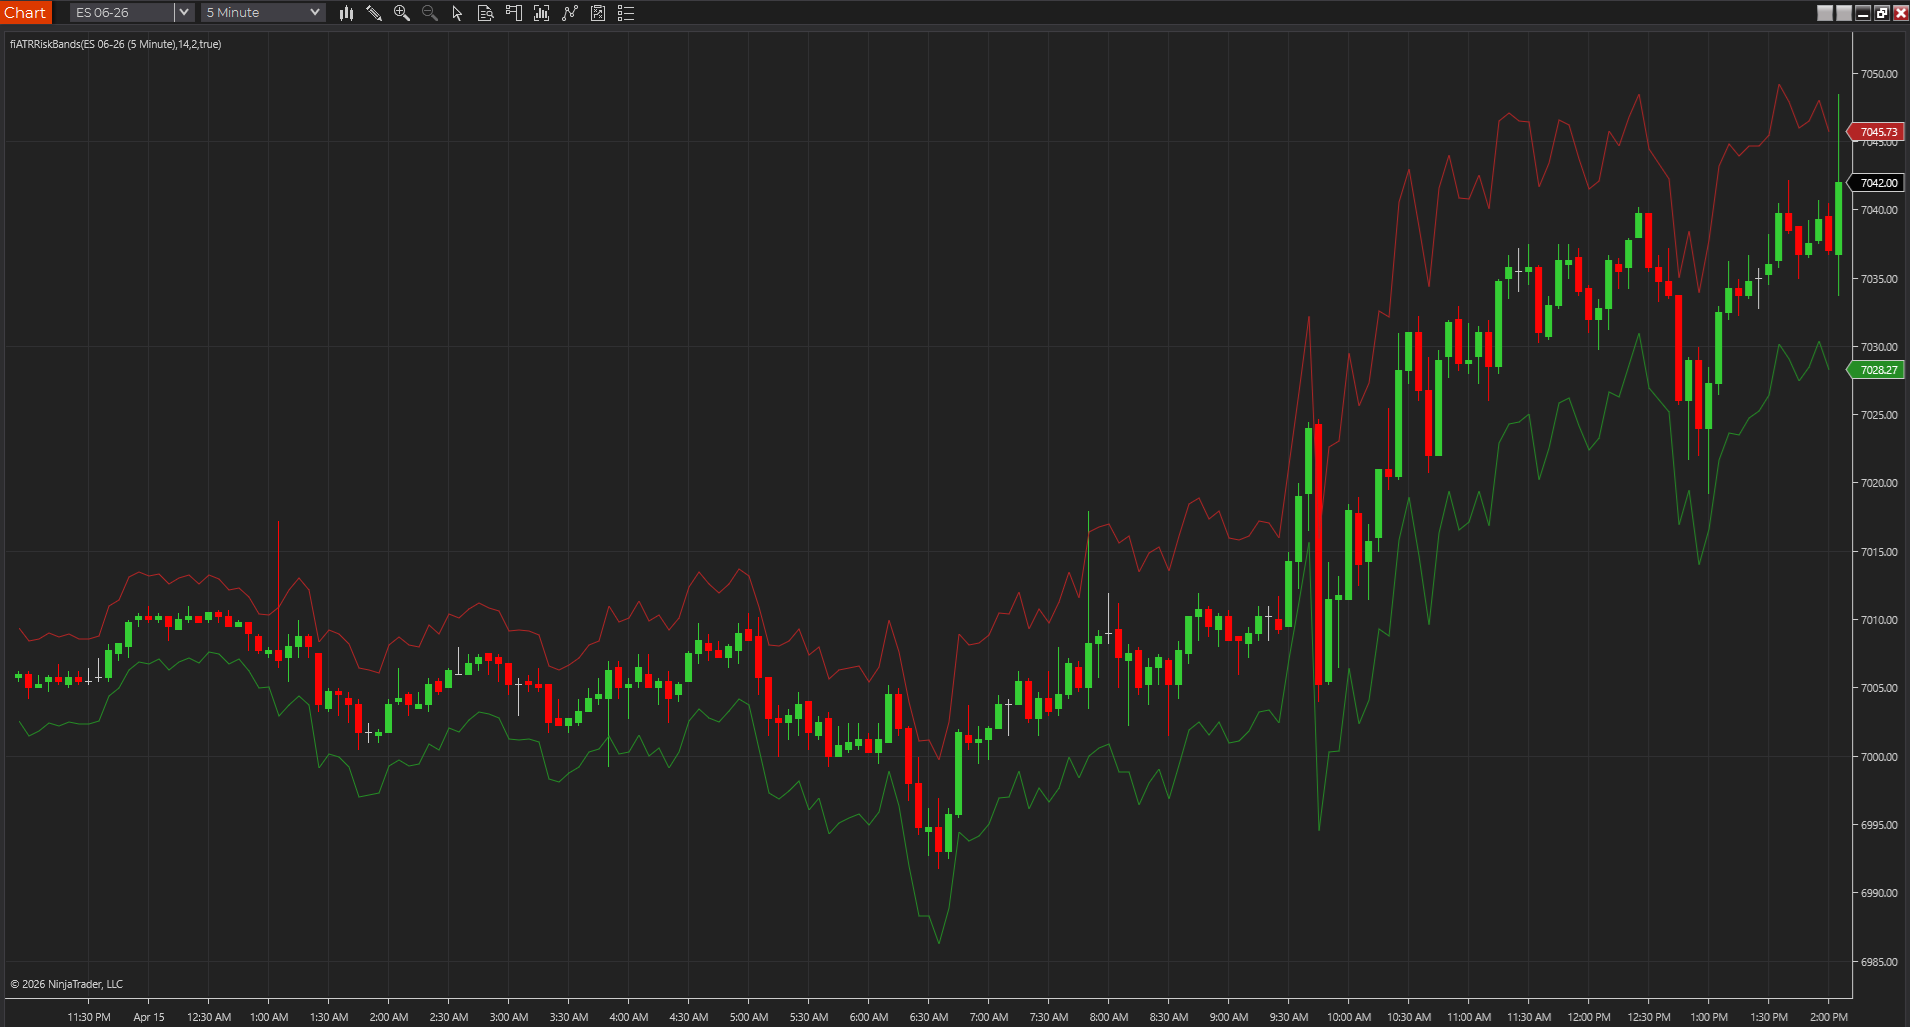
ATR bands around a directional move
ES 06-26 on a 5-minute NinjaTrader 8 chart with ATR Risk Bands framing the move using upper and lower volatility context.
Best fit
- Keeping volatility-adjusted context visible.
- Comparing fixed-tick risk against current movement.
- Seeing how far a multiple of ATR sits above and below price.
Before using it live
- Import the NinjaTrader 8 ZIP through NinjaTrader's normal import flow.
- Apply it to a clean chart first.
- Choose an ATR period and multiplier that match your timeframe.
- Review how the tool behaves on your actual session template, chart type, and instrument.
Settings to review
Controls the volatility lookback.
Sets how far the bands sit from the basis price.
Uses close instead of typical price as the band center.
Installation notes
- Import the NinjaTrader 8 ZIP through NinjaTrader's normal import flow.
- Apply it to a clean chart first.
- Choose an ATR period and multiplier that match your timeframe.
Downloads
Source code
These source examples are provided for copy/paste workflows on other charting platforms. Review and test any script in a simulator before using it on a live chart.
{
  ATR Risk Bands
  FreeIndicators.com source example.
  Works as a starting point for TradeStation EasyLanguage and MultiCharts PowerLanguage.
}

Inputs: ATRLength(14), Multiplier(2);
Vars: Basis(0), Distance(0);

Basis = Close;
Distance = AvgTrueRange(ATRLength) * Multiplier;

Plot1(Basis + Distance, "Upper");
Plot2(Basis - Distance, "Lower");// ATR Risk Bands
// FreeIndicators.com source example for MetaTrader 4.
#property indicator_chart_window
#property indicator_buffers 3
#property indicator_color1 DodgerBlue
#property indicator_color2 Crimson
#property indicator_color3 SeaGreen
double Buffer1[];
double Buffer2[];
double Buffer3[];
int init() {
SetIndexBuffer(0, Buffer1);
SetIndexBuffer(1, Buffer2);
SetIndexBuffer(2, Buffer3);
return(0);
}
int start() {
int counted = IndicatorCounted();
int limit = Bars - counted - 1;
int atrLength = 14;
double multiplier = 2.0;
for(int i = limit; i >= 0; i--) {
double atr = iATR(NULL, 0, atrLength, i);
Buffer1[i] = Close[i] + atr * multiplier;
Buffer2[i] = Close[i] - atr * multiplier;
}
return(0);
}// ATR Risk Bands
// FreeIndicators.com source example for MetaTrader 5.
#property indicator_chart_window
#property indicator_buffers 3
#property indicator_plots 3
double Buffer1[];
double Buffer2[];
double Buffer3[];
int OnInit() {
SetIndexBuffer(0, Buffer1, INDICATOR_DATA);
SetIndexBuffer(1, Buffer2, INDICATOR_DATA);
SetIndexBuffer(2, Buffer3, INDICATOR_DATA);
return(INIT_SUCCEEDED);
}
int OnCalculate(const int rates_total,
const int prev_calculated,
const datetime &time[],
const double &open[],
const double &high[],
const double &low[],
const double &close[],
const long &tick_volume[],
const long &volume[],
const int &spread[]) {
int start = prev_calculated > 1 ? prev_calculated - 1 : 1;
int atrLength = 14;
double multiplier = 2.0;
for(int i = start; i < rates_total; i++) {
double tr = MathMax(high[i] - low[i], MathMax(MathAbs(high[i] - close[i - 1]), MathAbs(low[i] - close[i - 1])));
Buffer1[i] = close[i] + tr * multiplier;
Buffer2[i] = close[i] - tr * multiplier;
}
return(rates_total);
}//@version=5
indicator("ATR Risk Bands", overlay=true)
atrLength = input.int(14, "ATR length")
multiplier = input.float(2.0, "Multiplier")
distance = ta.atr(atrLength) * multiplier
plot(close + distance, "Upper ATR band", color=color.red)
plot(close - distance, "Lower ATR band", color=color.green)Limitations
- ATR expands after volatility already increases.
- Bands are visual context, not automated stops.
- Settings need separate review for each market and timeframe.
Frequently asked questions
Does it repaint?
This indicator is designed as a chart reference tool, not as a hindsight-only backfitted signal. Even so, you should still test it bar by bar on your chart type to confirm how it behaves on the active bar.
Which platforms are covered?
NinjaTrader 8, TradeStation EasyLanguage, MultiCharts PowerLanguage, MetaTrader 4, MetaTrader 5, TradingView Pine Script are currently represented through downloads or source pages.
Is source code included?
Yes. This page includes source examples or links to platform-specific source pages where applicable.