Guide walkthrough
Start reading here
This is the main article body, where the page shifts from summary cards into the actual workflow and decision-making notes.
On this page
Key terms for this guide
These glossary pages cover the ideas and platform language most likely to matter as you work through this guide.
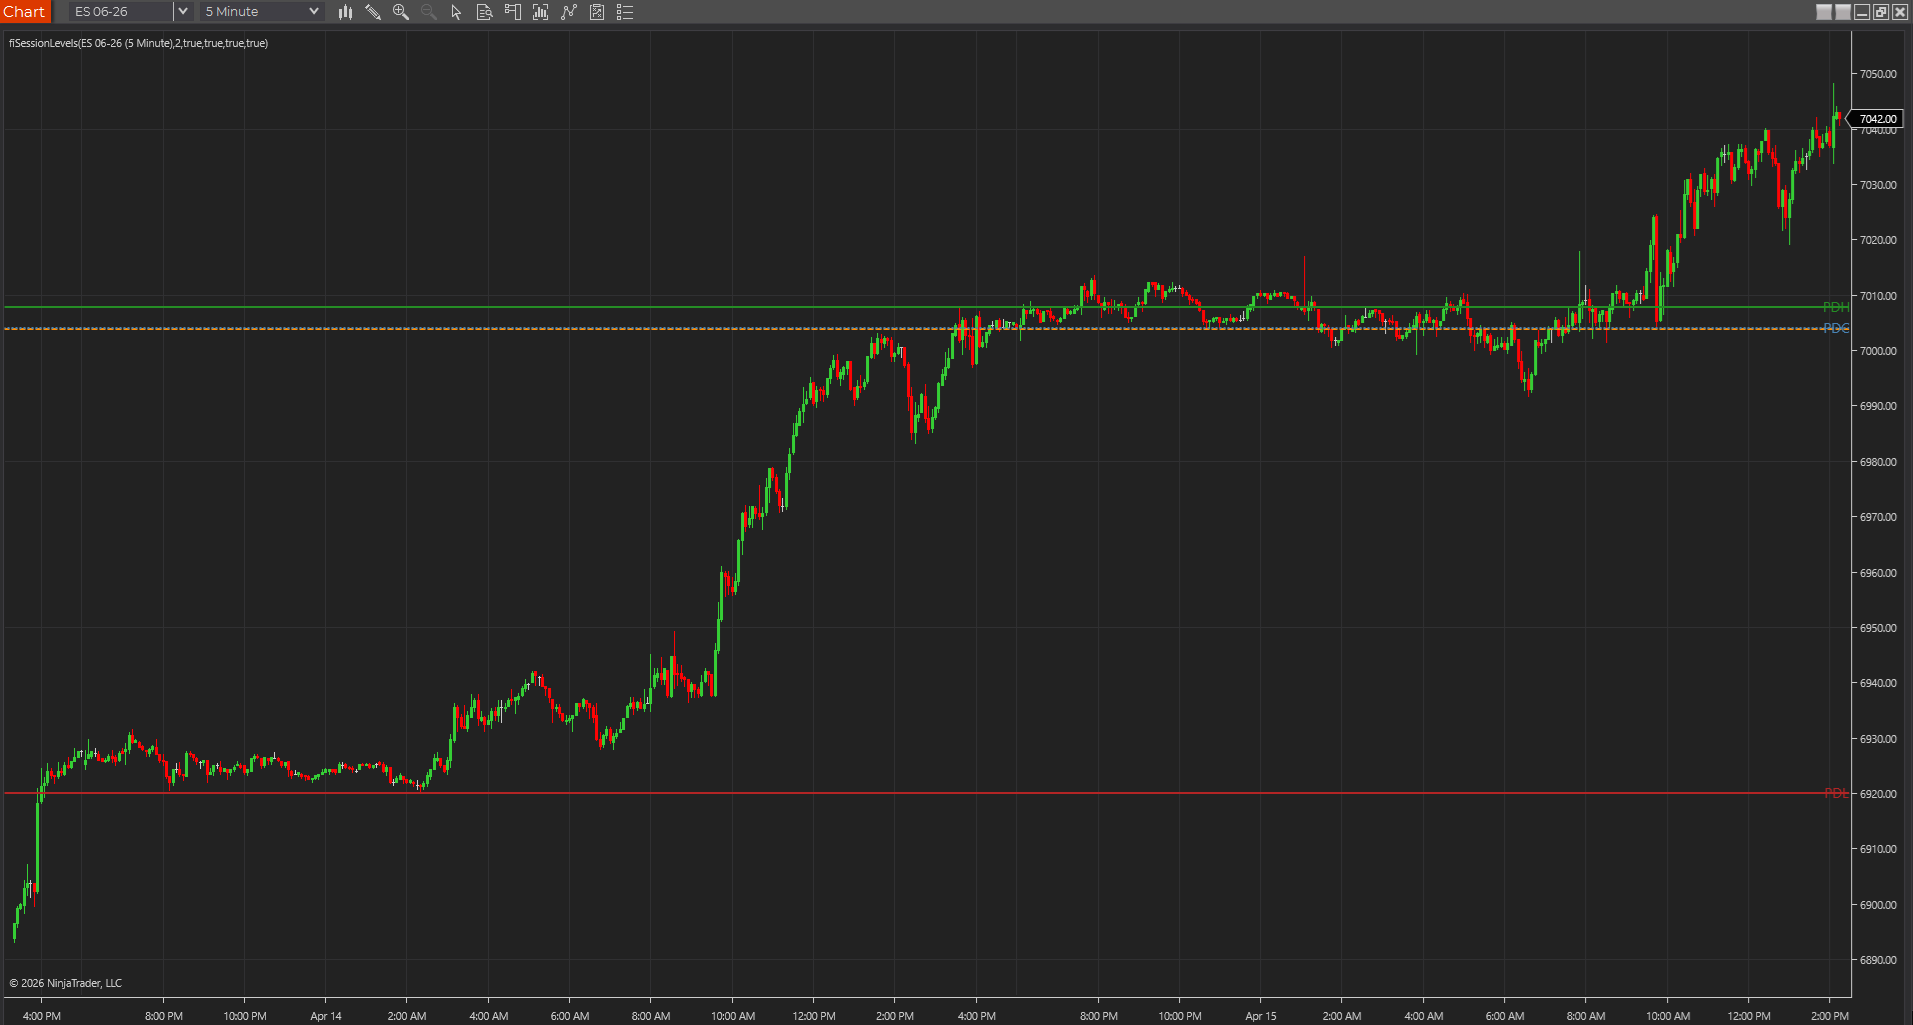
Session levels are raw references
Prior-session highs, lows, opens, and closes show what the market actually printed. They are direct context levels with no extra formula layered on top, which is why they often feel cleaner and more literal on an intraday chart.
- These are the fastest way to answer where price sits relative to yesterday's actual auction.
- They are especially useful when the prior high, low, or close still feels active in today's trade.
- If you want the chart to stay grounded in what really happened, session levels are hard to beat.
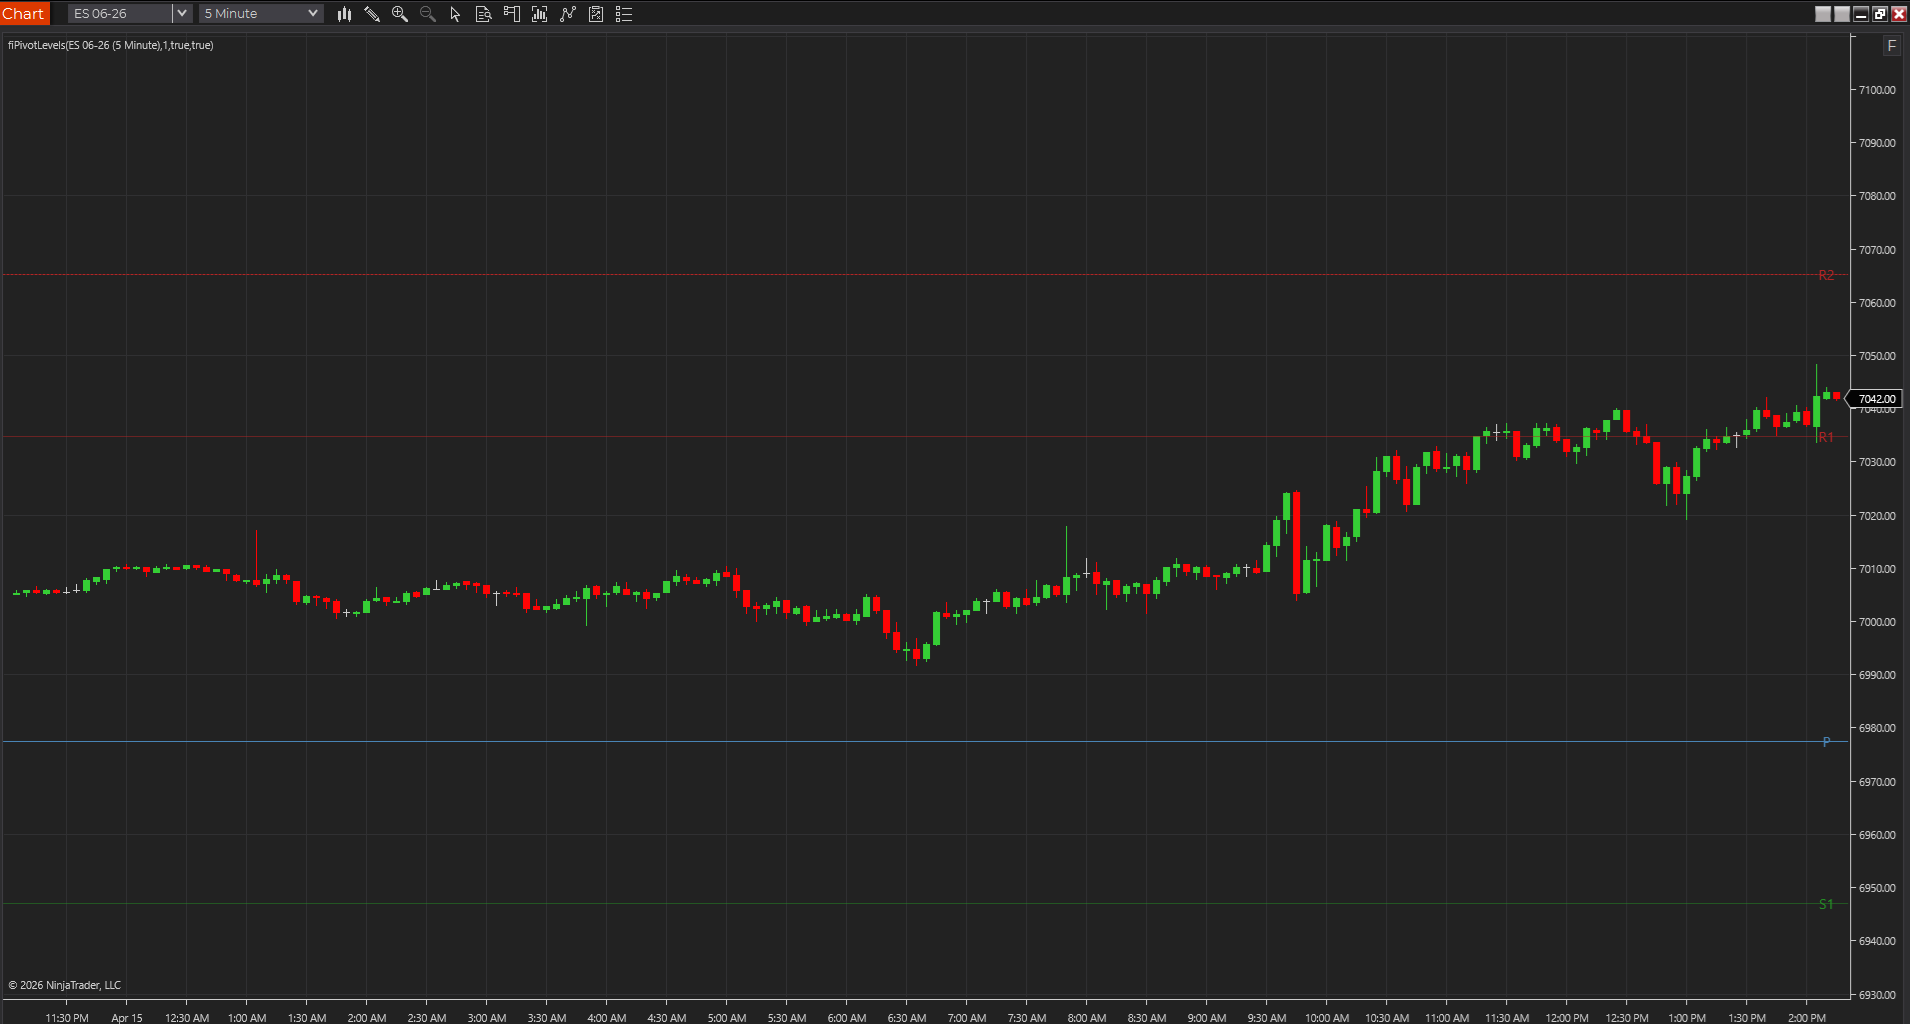
Pivot levels are derived levels
Pivot studies calculate new reference prices from prior-session data. That creates a structured support-and-resistance framework for the current session, but it is a different workflow from simply watching the raw session map.
- Pivots are useful when you want projected levels before price reaches them.
- They create a ladder, which can help traders who like a cleaner planned framework.
- The important thing is to remember that the levels are derived, not literal auction prices.
The choice depends on whether you want literal context or projected structure
If the chart question is 'where did the market really trade yesterday?' session levels are the better answer. If the chart question is 'what framework do I want for today's session?' pivots often make more sense.
- Literal and projected levels can both be useful, but they should not be confused.
- A lot of chart clutter starts when traders treat both maps as if they are saying the same thing.
- Naming the job clearly makes the choice easier.
Many traders use both for different reasons
Session levels are often better for orientation and auction context. Pivot levels are often better when you want a cleaner ladder of projected reference prices for the current session. Used together, they can complement each other well as long as the chart does not become a wall of horizontal lines.
- Session levels can anchor the chart to reality.
- Pivots can add a planned framework for the current day.
- Overlap between the two often deserves more attention than either map by itself.
Best next reads
These pages pick up the questions most readers usually have next, so you do not have to back out and start a fresh search.
Frequently asked questions
Are pivot levels more important than prior-session highs and lows?
Not automatically. They are different tools. Session levels show the actual prior auction, while pivots create a projected framework for the current session.
Which one is easier for new traders to read?
Session levels are usually easier because they are literal references. Pivots can still be useful, but they ask the trader to work with a derived ladder instead of raw prices.
Should both be on the same chart?
Sometimes, yes, especially when session levels provide orientation and pivots provide a planned framework. The key is keeping the chart readable.