Guide walkthrough
Start reading here
This is the main article body, where the page shifts from summary cards into the actual workflow and decision-making notes.
On this page
Key terms for this guide
These glossary pages cover the ideas and platform language most likely to matter as you work through this guide.
Remove overlap before you remove information
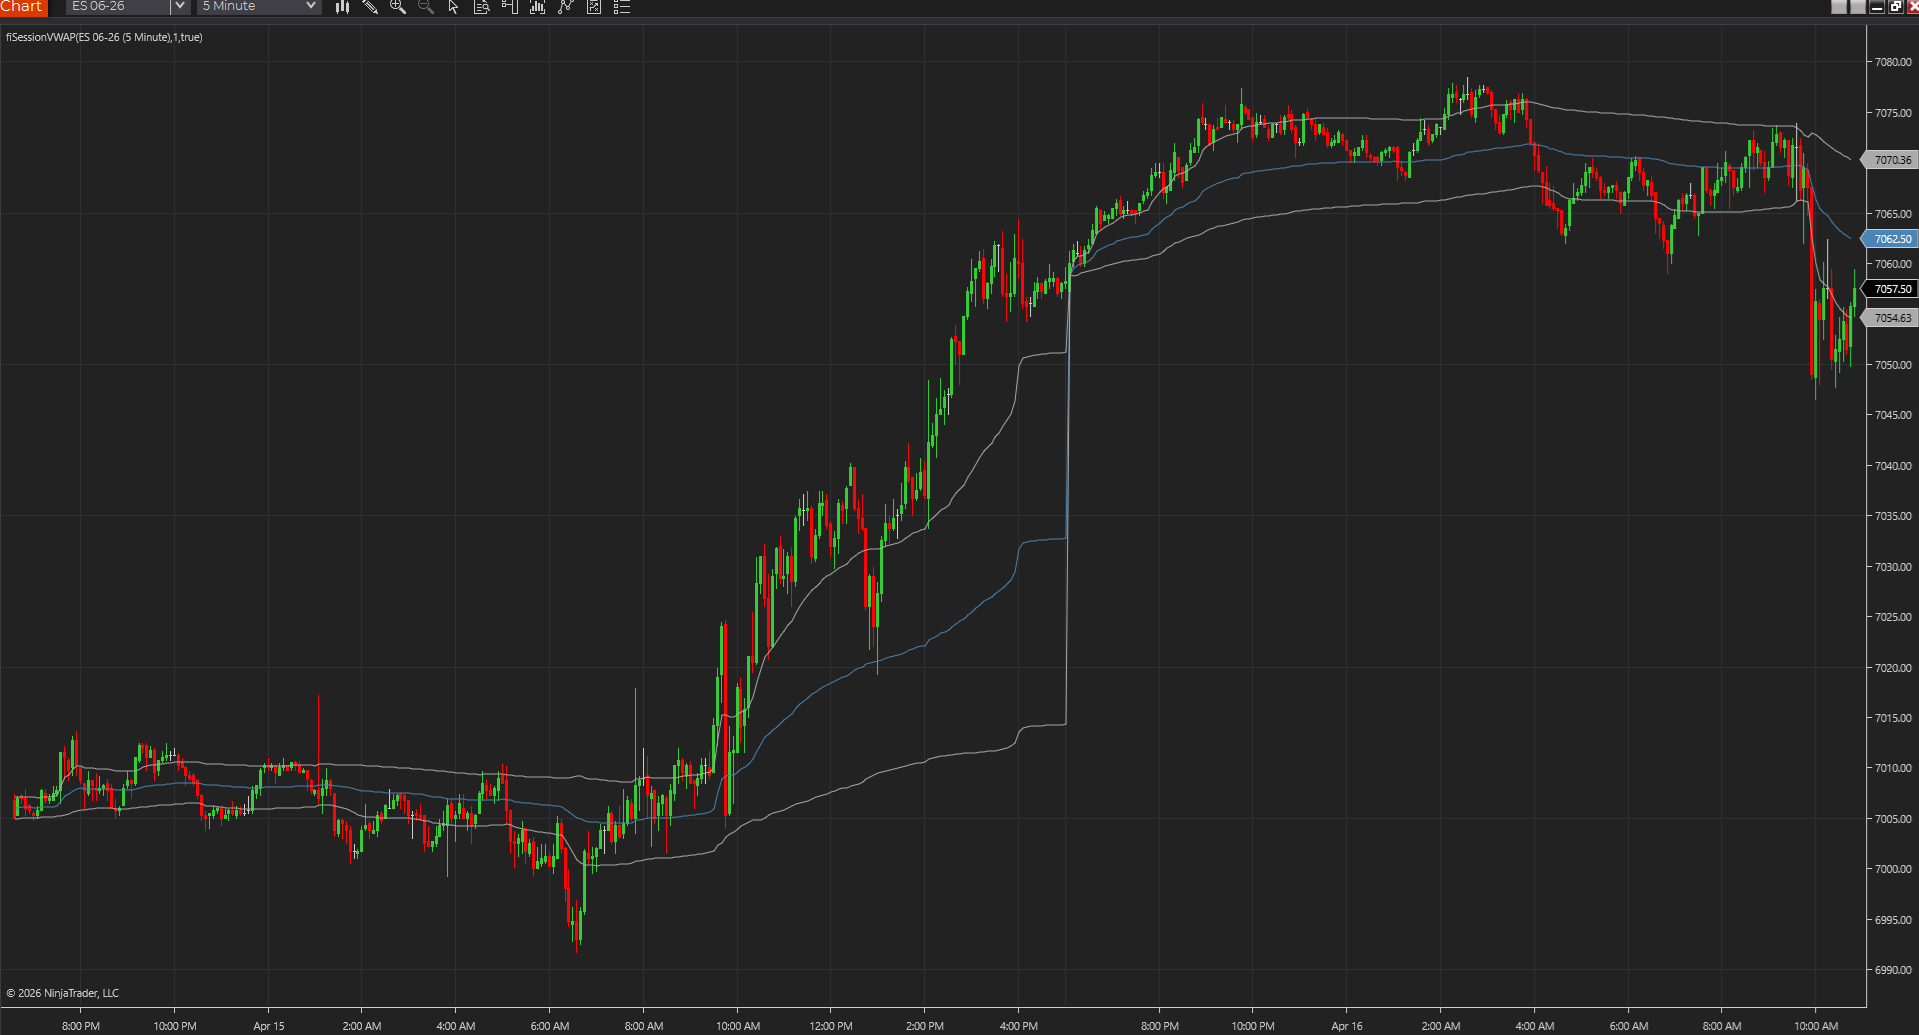
Most clutter problems start with overlap, not with total indicator count alone. The chart becomes unreadable when several tools are all trying to explain trend, location, or momentum in slightly different ways. That is the first thing to fix.
- Choose one primary structure read, not three.
- Choose one main location framework for the session.
- Choose one risk tool that keeps expectations realistic.
Keep the chart optimized for live scanning
A futures chart should be judged by how it reads when the pace speeds up, not by how complete it looks in a calm screenshot. If labels, bands, and reference lines make it harder to scan the next 10 seconds of price action, the stack is already too heavy.
- Hide or mute anything that matters only occasionally.
- Reduce visual competition between price and overlays.
- Use replay to spot where your eyes are getting dragged away from the actual chart.
Build around decisions, not categories
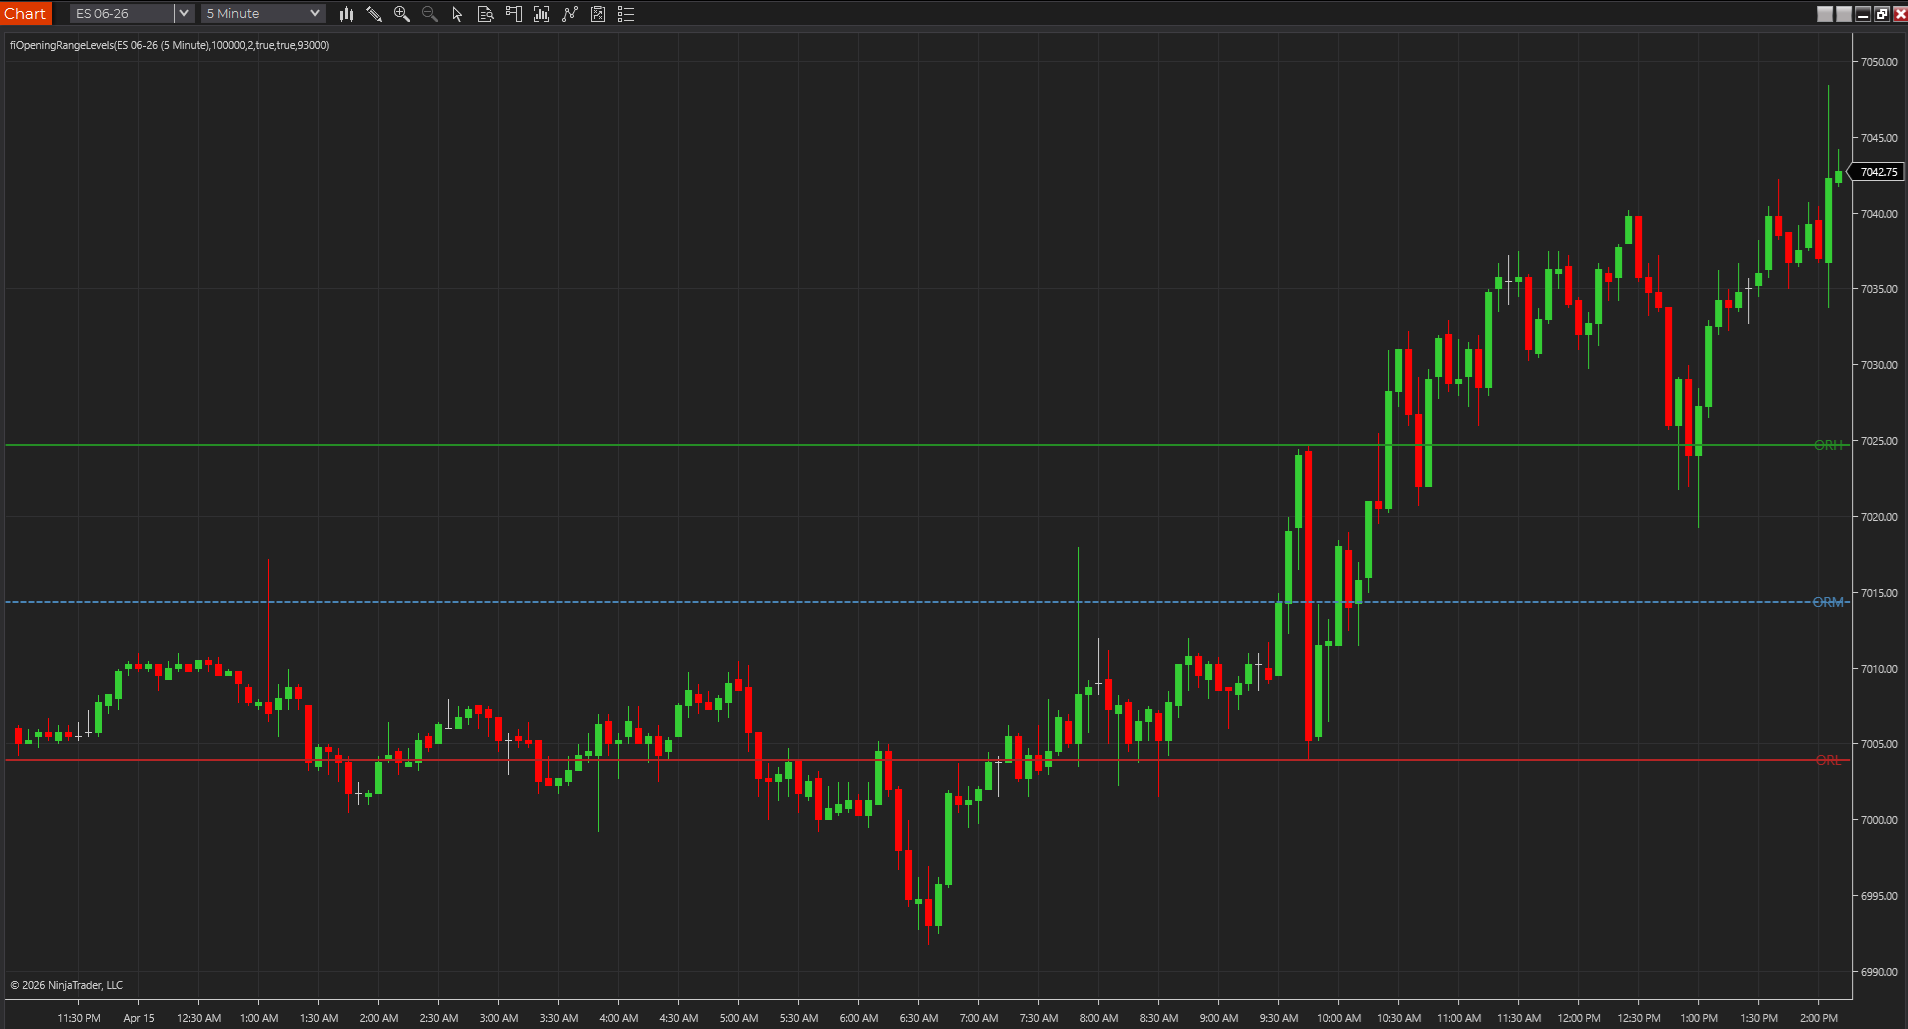
A cleaner chart usually appears when each remaining tool earns its space by improving one repeat decision. That standard is better than keeping something just because it belongs to a popular category like VWAP, order flow, or structure.
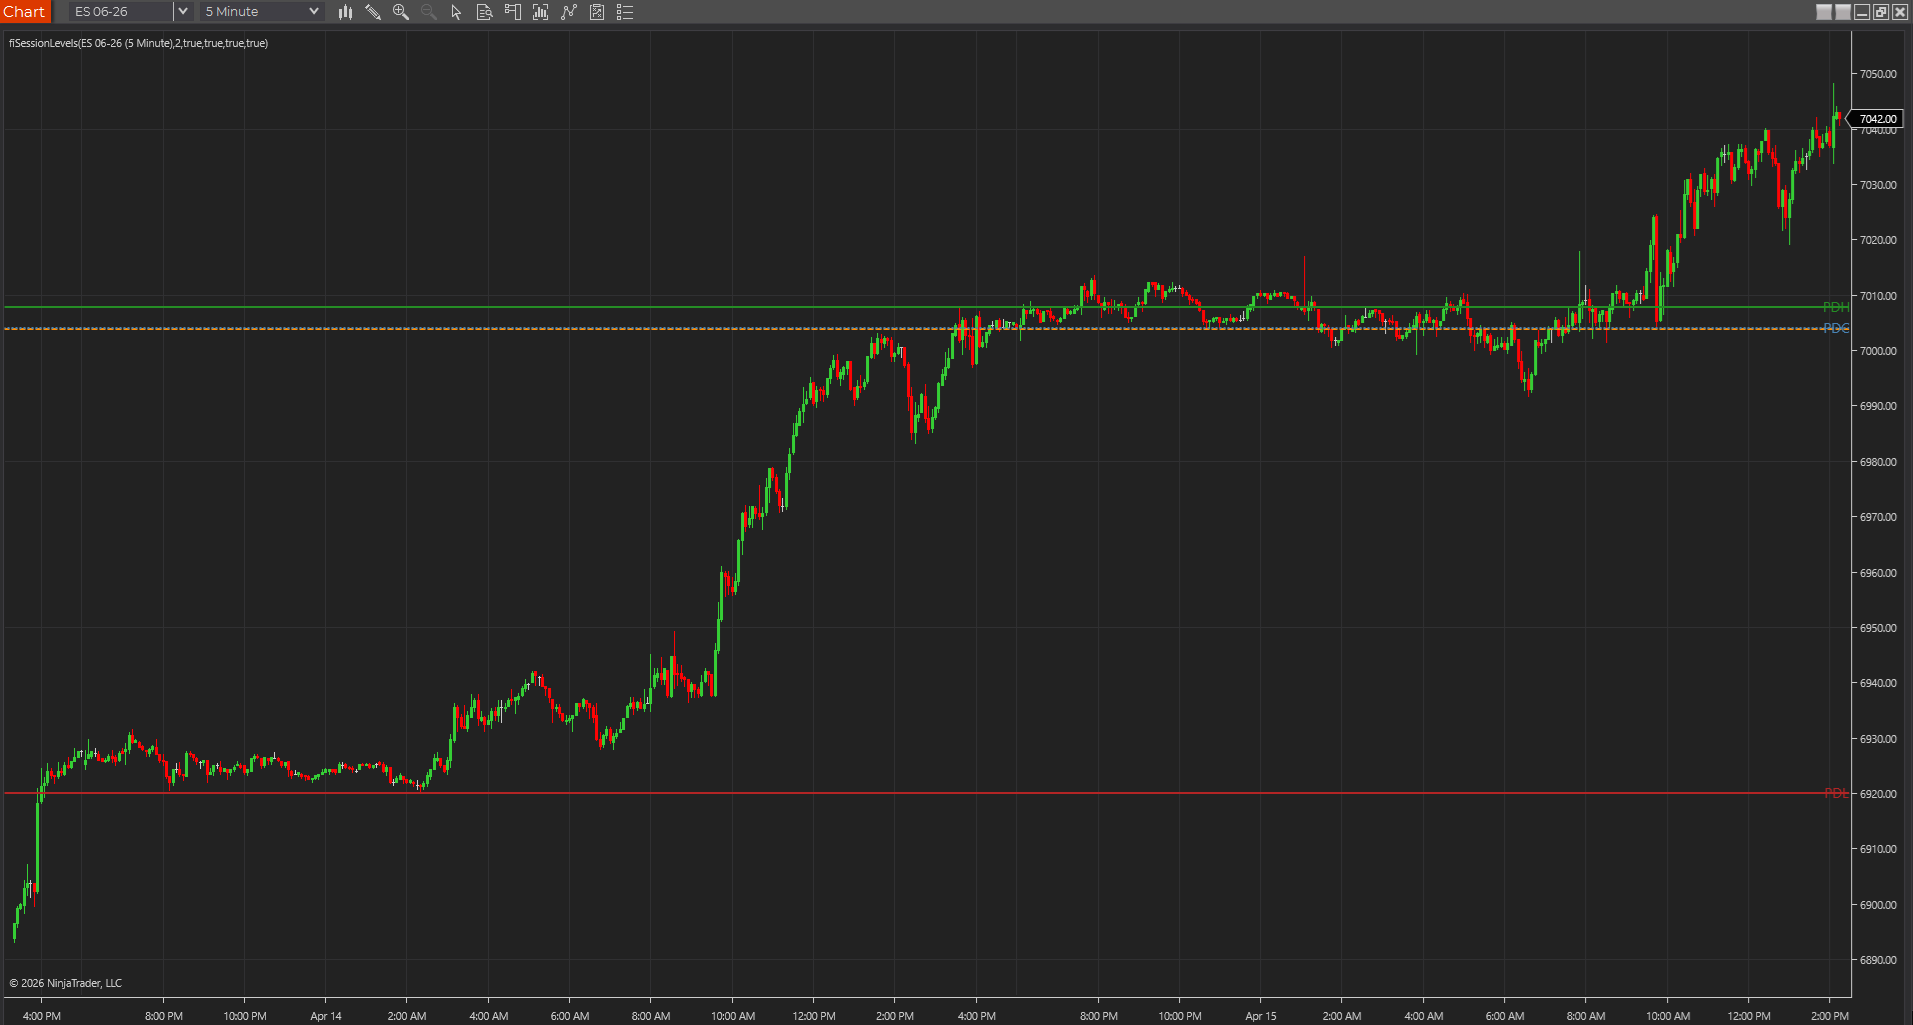
- Ask which tool changes your read of location.
- Ask which tool changes your read of participation.
- Ask which tool changes your read of risk or exit management.
Simpler charts are often more trustworthy
Trust increases when the trader knows exactly why each remaining layer is there. A simpler chart is easier to test, easier to explain, and easier to challenge honestly when it stops helping. That is one reason clean stacks tend to age better than crowded ones.
- Simple stacks are easier to replay consistently.
- They also make weak tools more obvious sooner.
- That keeps the chart closer to a working process than a collection habit.
Cleaning up a chart usually means deleting a favorite, not just a redundant extra
This is where the cleanup gets real. Most traders already know how to remove the obviously useless tool. The harder move is removing a study they like but that no longer earns its space because another layer now answers the same question better. That is usually the step that creates the biggest jump in readability.
- The chart often improves most when a familiar but overlapping tool gets removed.
- Preference is not the same thing as usefulness under pressure.
- That is why cleanup should be based on decisions, not attachment.
Best next reads
These pages pick up the questions most readers usually have next, so you do not have to back out and start a fresh search.
Frequently asked questions
Is indicator clutter mainly a beginner problem?
Not at all. Experienced traders can accumulate clutter too, especially when every new tool is added without removing an older one that already solved the same job.
What is the fastest way to clean up a crowded futures chart?
Group the indicators by job, then remove the overlapping ones first. That usually produces a cleaner result faster than tuning colors or panel settings.
Should I save a cluttered template before simplifying it?
Usually yes. Saving the older version makes it easier to compare the cleaner chart honestly and prevents the cleanup process from feeling irreversible, which makes better decisions easier.