Guide walkthrough
Start reading here
This is the main article body, where the page shifts from summary cards into the actual workflow and decision-making notes.
On this page
Key terms for this guide
These glossary pages cover the ideas and platform language most likely to matter as you work through this guide.
Pick one job per layer
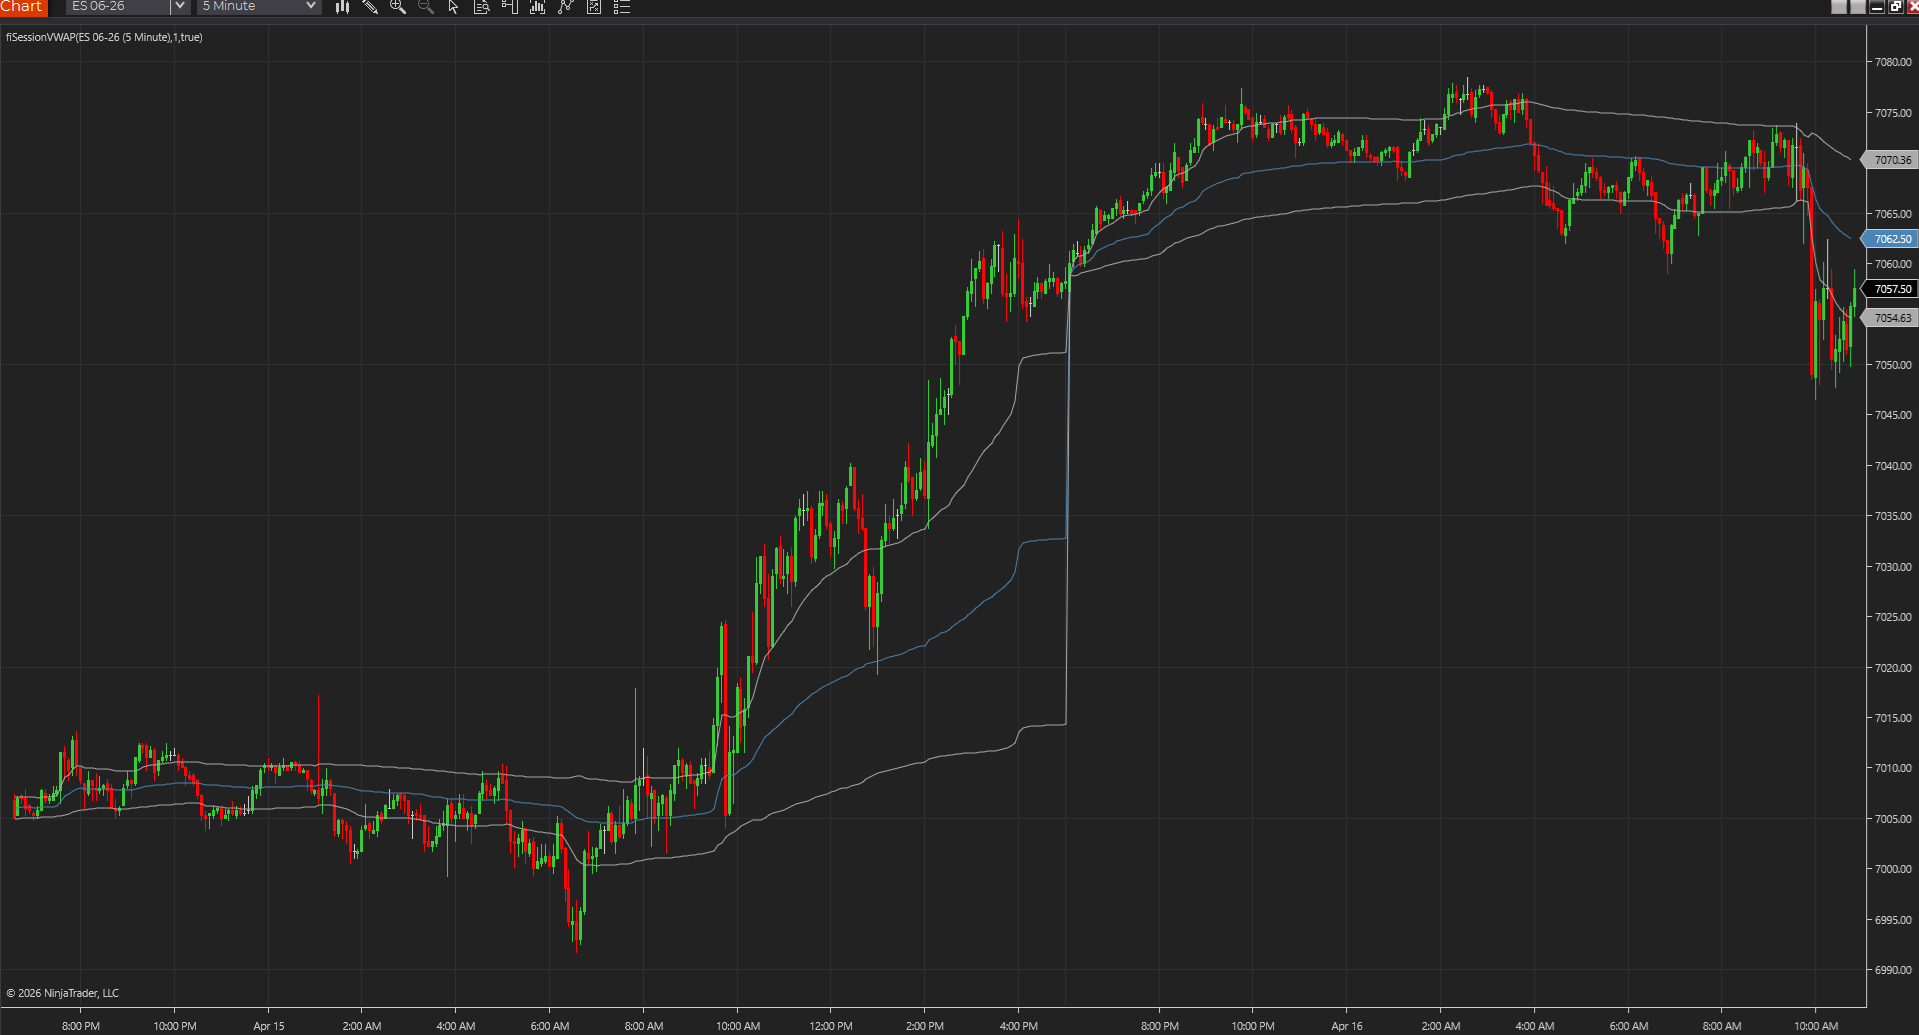
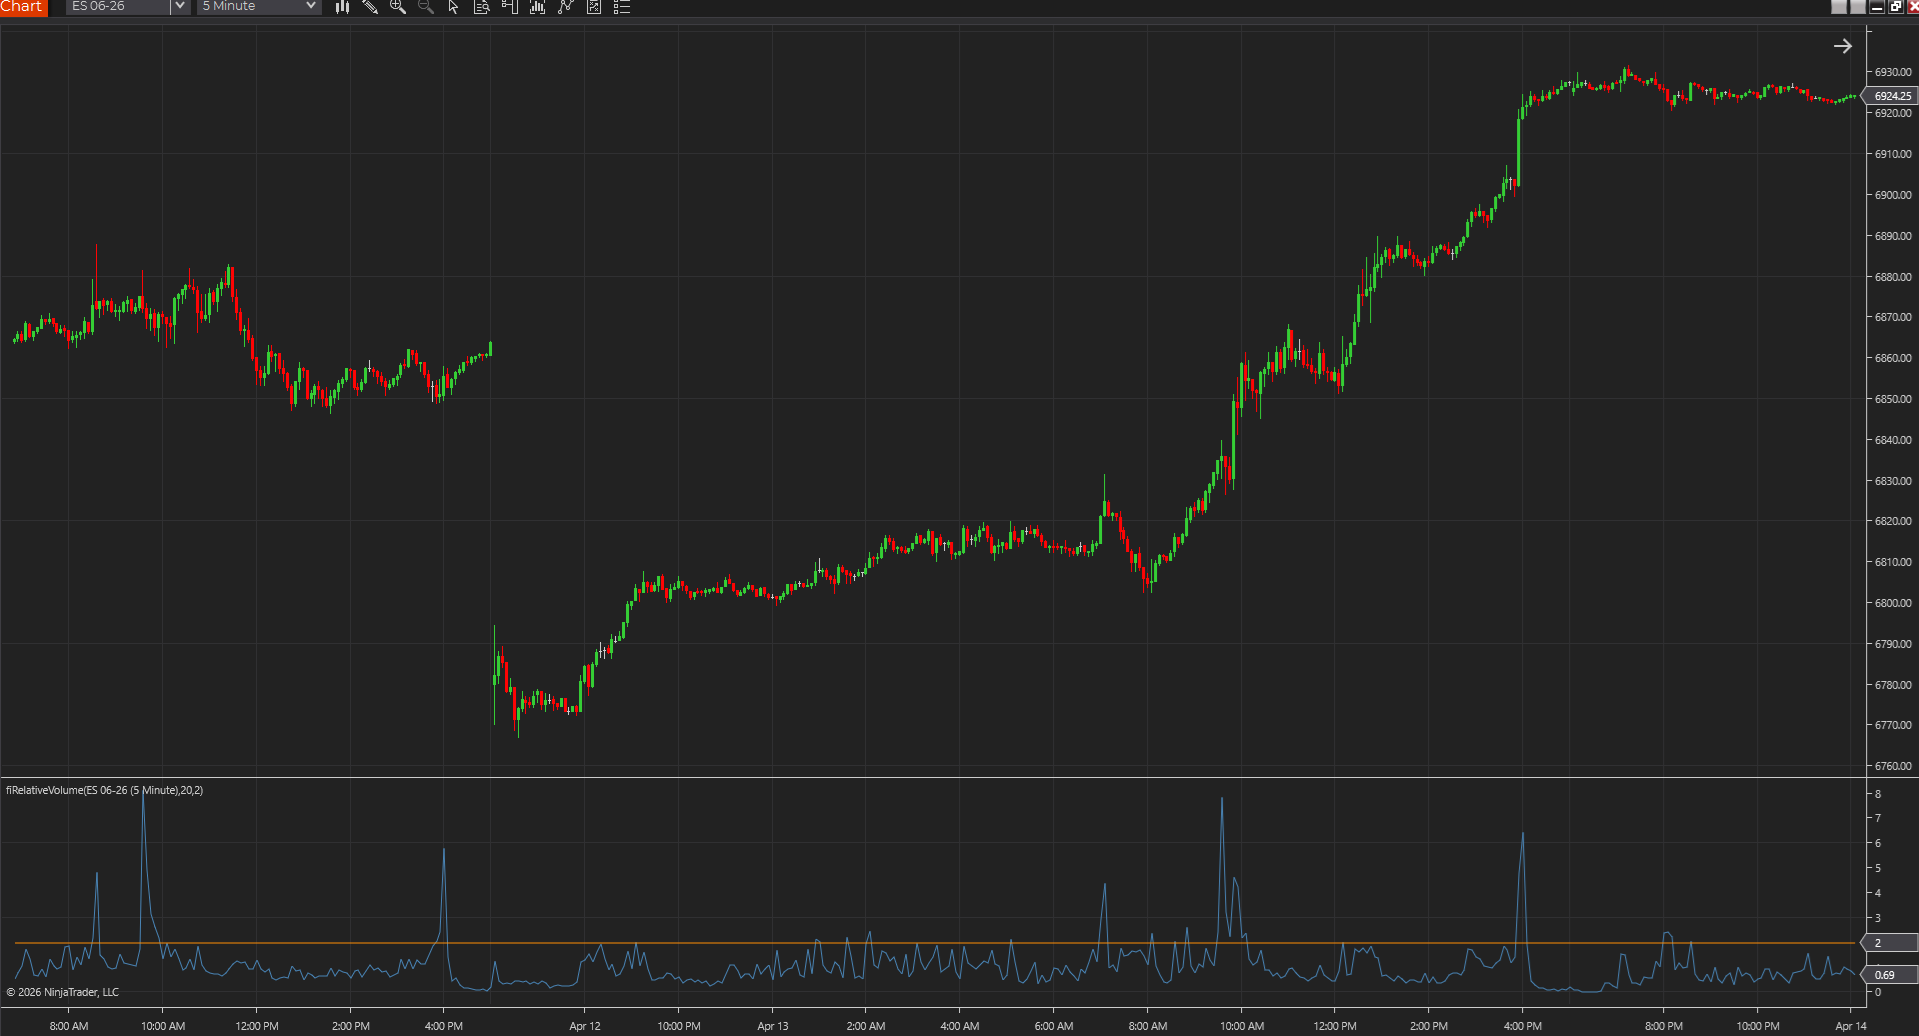
A simple futures-open chart usually works best when each tool has a single job. One layer should frame structure, one should show whether participation is expanding, and one should keep risk expectations honest. Once two tools start doing the same job, clutter usually wins.
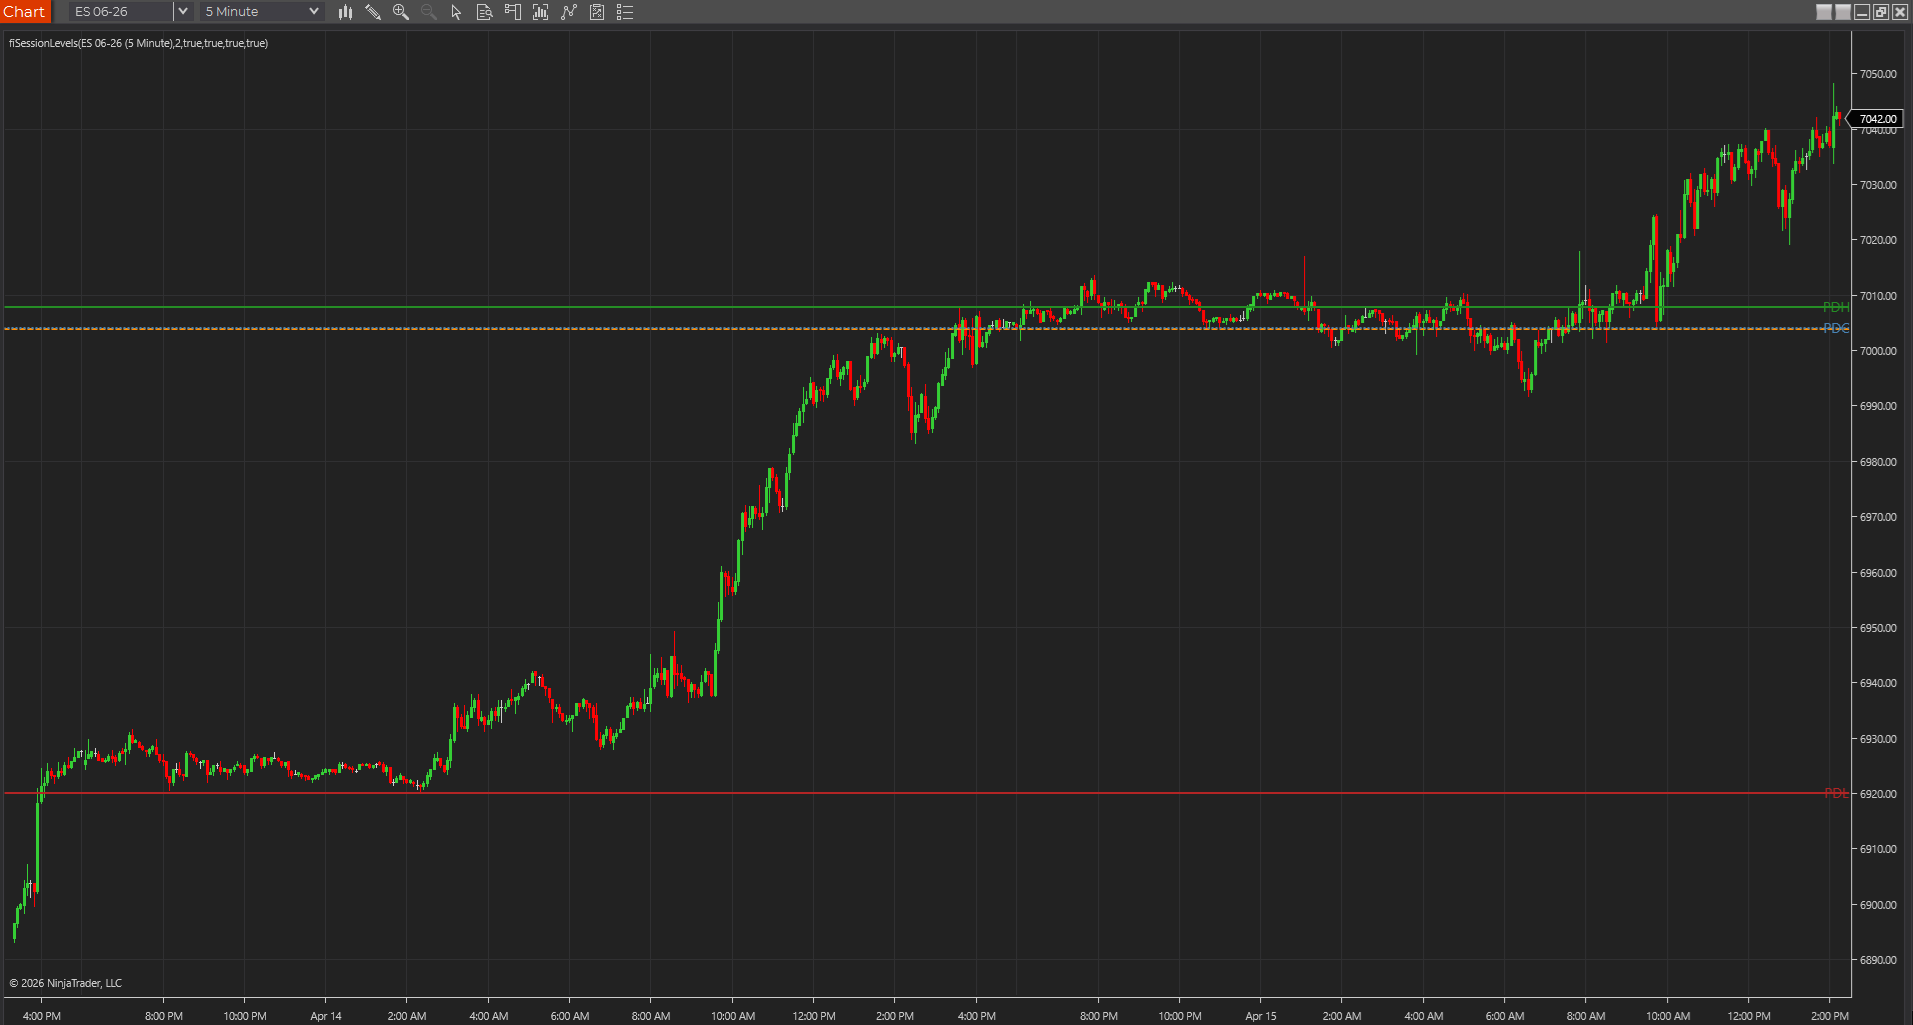
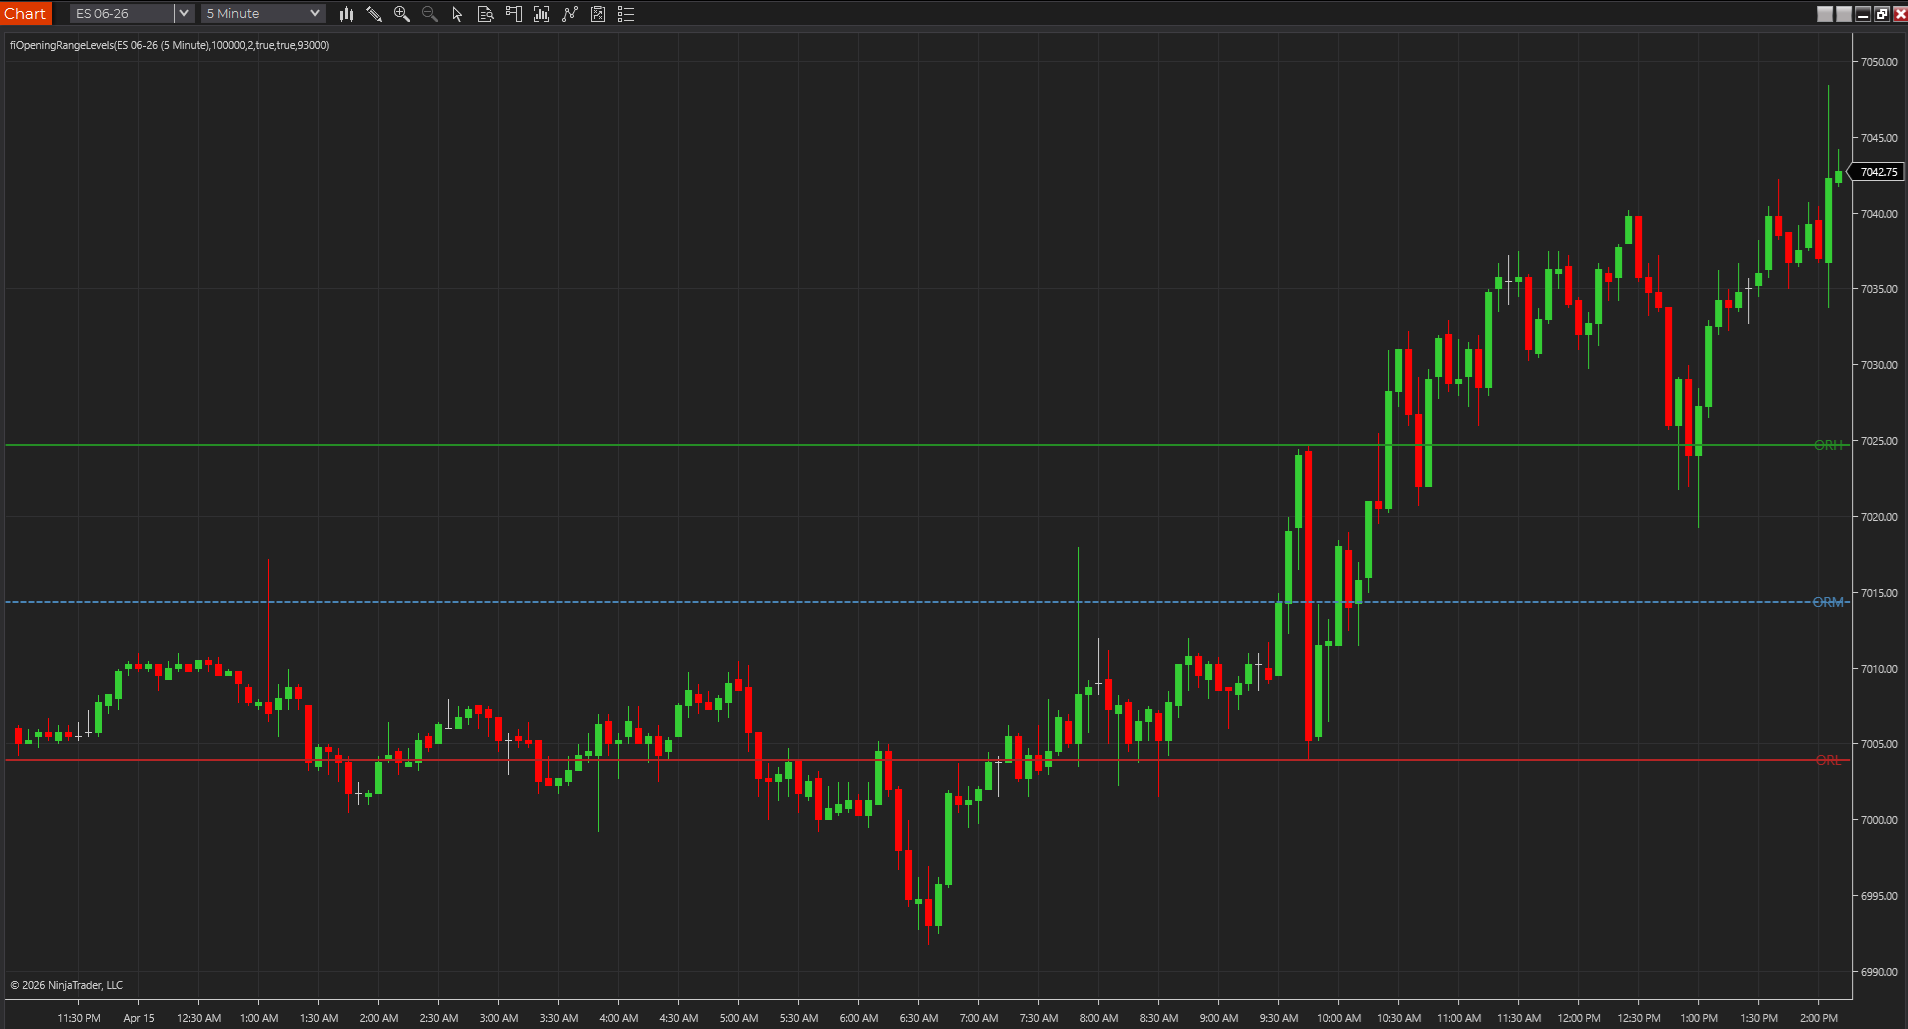
- Use opening range or prior-session levels for fast structure.
- Use VWAP or a participation tool to judge how believable the move is.
- Use ATR or another risk overlay to keep the opening burst in perspective.
Build around the first question you ask at the open
Most active futures traders start by asking some version of the same question: are we breaking away from value, rotating inside early balance, or stretching into a level too quickly? The chart should be built to answer that question first instead of trying to support every possible style at once.
- Opening range tools help if the first move matters most to you.
- VWAP helps if you care about how price is behaving relative to fair value.
- Participation tools matter when the move needs confirmation, not just visibility.
Use higher-time-frame context sparingly
A futures-open chart gets better when one or two higher-time-frame references are available, but worse when it is covered in weekly, monthly, gap, and pivot lines all at once. The goal is orientation, not a maze of historical prices.
- Carry only the levels that regularly influence your actual decisions.
- Hide the rest until they prove useful enough to earn the space.
- A clean open chart is usually faster than a more complete one.
Simulator proof matters more than aesthetic balance
A simple stack should still earn its place with replay or simulator work. The strongest futures-open stack is not the one that looks balanced in a screenshot. It is the one that helps you read the same early session decisions more consistently without masking price itself.
- Replay the first 30 to 60 minutes with the same stack for several sessions.
- Remove anything that does not change a real decision.
- Keep the chart simple enough that price is still the main signal.
If the first five minutes feel visually busy, the stack is probably already too heavy
This is a useful test because the futures open does not give the trader much time to negotiate with a cluttered chart. If the first few minutes feel visually noisy, the problem is usually not that you need one more confirmation tool. It is that one of the current layers is already duplicating another job. A good open stack should feel readable under pressure, not just sensible when the market is closed.
- Open-time readability is a stronger test than after-hours neatness.
- Duplicate jobs create more hesitation than more insight.
- The best stack usually feels slightly simpler than the trader first expects.
Best next reads
These pages pick up the questions most readers usually have next, so you do not have to back out and start a fresh search.
Frequently asked questions
How many indicators should be on a futures-open chart?
For most traders, three core jobs are enough: structure, participation, and risk. More than that often becomes harder to read instead of more helpful.
Should VWAP be on every futures-open chart?
Not automatically. It is useful when fair value matters to your read, but it should earn the space just like any other tool.
What should I remove first if the futures-open chart feels crowded?
Usually the tool that overlaps most with another layer. If two studies are both trying to answer the same early-session question, one of them is often adding hesitation more than clarity.