Guide walkthrough
Start reading here
This is the main article body, where the page shifts from summary cards into the actual workflow and decision-making notes.
On this page
Verify passing is only the start of the test
TradeStation makes it easy to stop after Verify, but that is only a syntax checkpoint. The real test starts when the study is placed on a plain chart and you confirm the plots, session logic, and inputs make sense under normal market conditions.
- Syntax success does not validate chart behavior.
- A study can compile and still be wrong because the chart setup is wrong.
- That is why the first chart matters more than the first verify.
Use one plain chart before any workspace template
Load the study on a clean chart with a common symbol and the exact session you plan to trade. This is the fastest way to catch whether the indicator belongs on price or in a subgraph, whether the defaults are sane, and whether the output looks believable before a saved workspace hides the problems.
- Use Format Analysis Techniques immediately after loading the study.
- Check pane placement, colors, and the default inputs before you judge the visual result.
- The point is to isolate the study from workspace noise.
Check Data2 and session assumptions explicitly
Many TradeStation indicator problems are not really indicator problems. They are chart-assumption problems. If the code expects Data2, prior-session references, or a specific regular session, the chart has to provide those things or the result will drift quietly.
- Add extra data streams before assuming the logic is broken.
- Session-sensitive studies deserve a test on the exact futures session you use.
- A wrong session template can make a good indicator look bad.
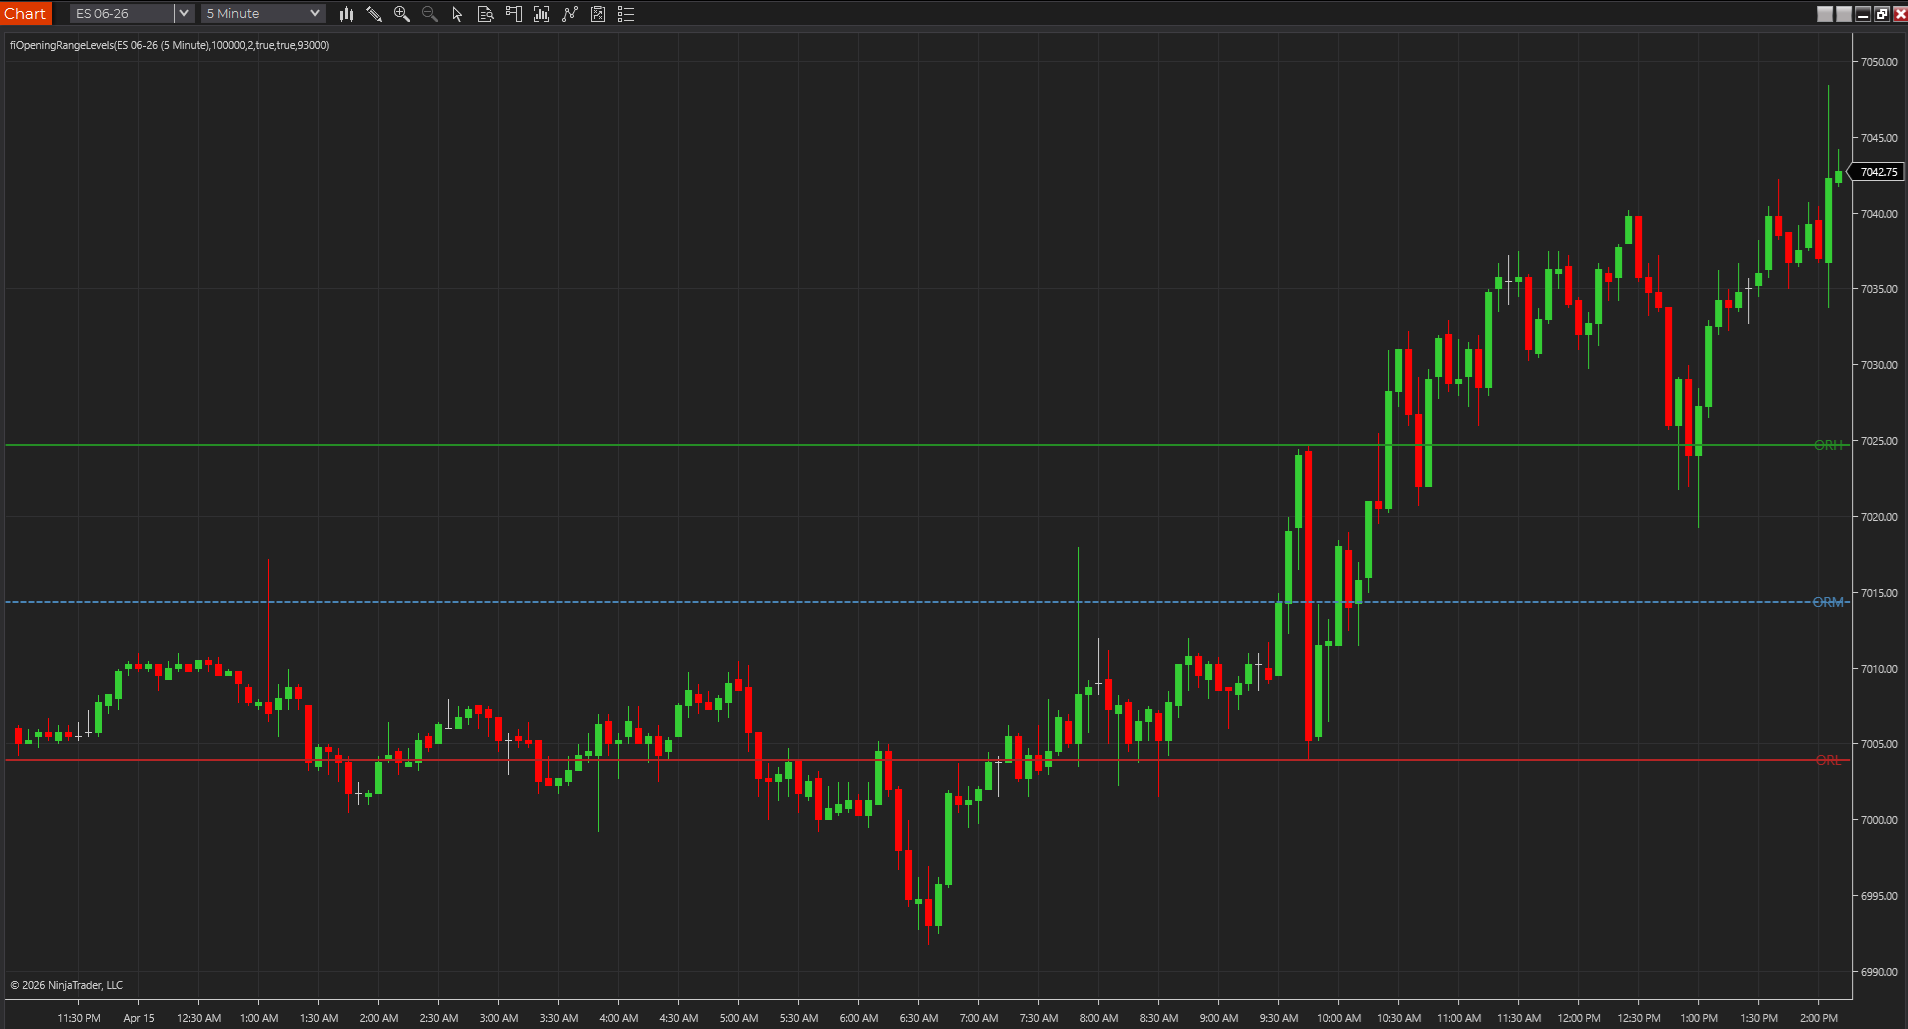
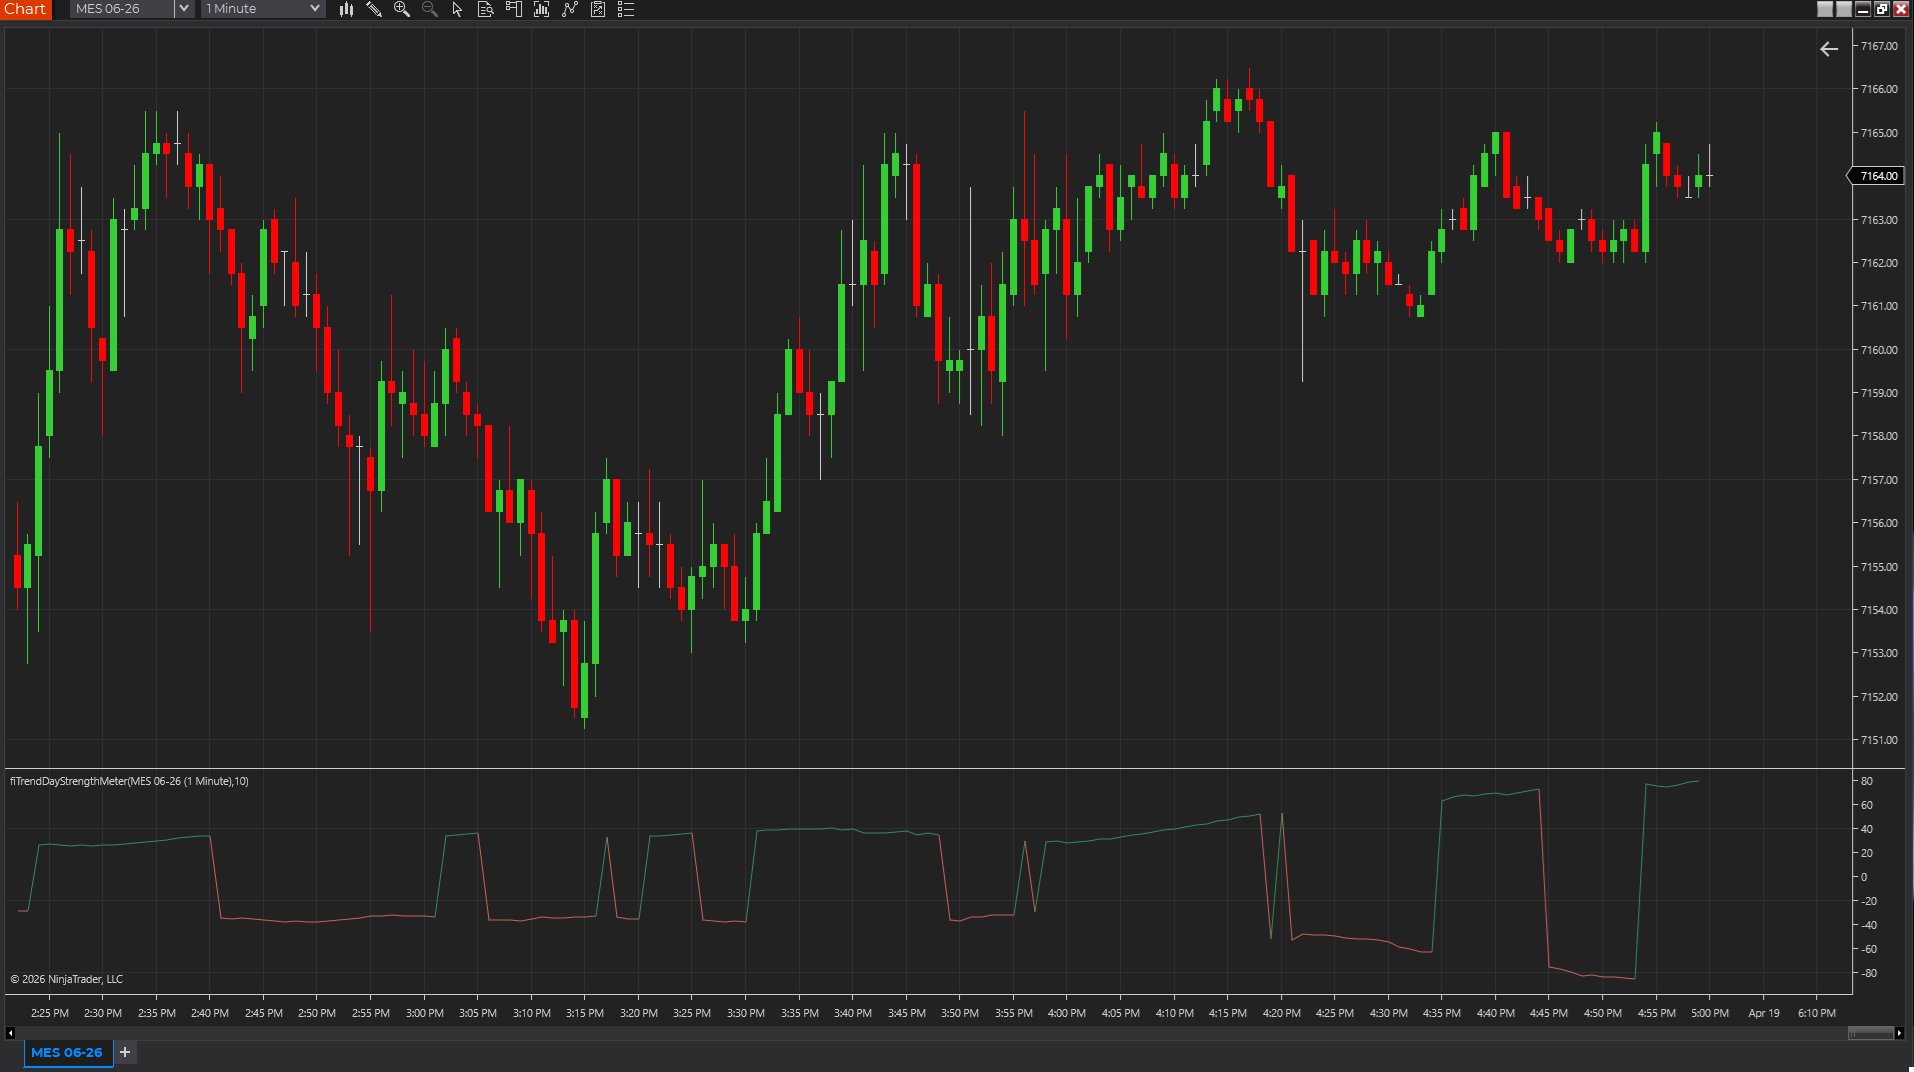
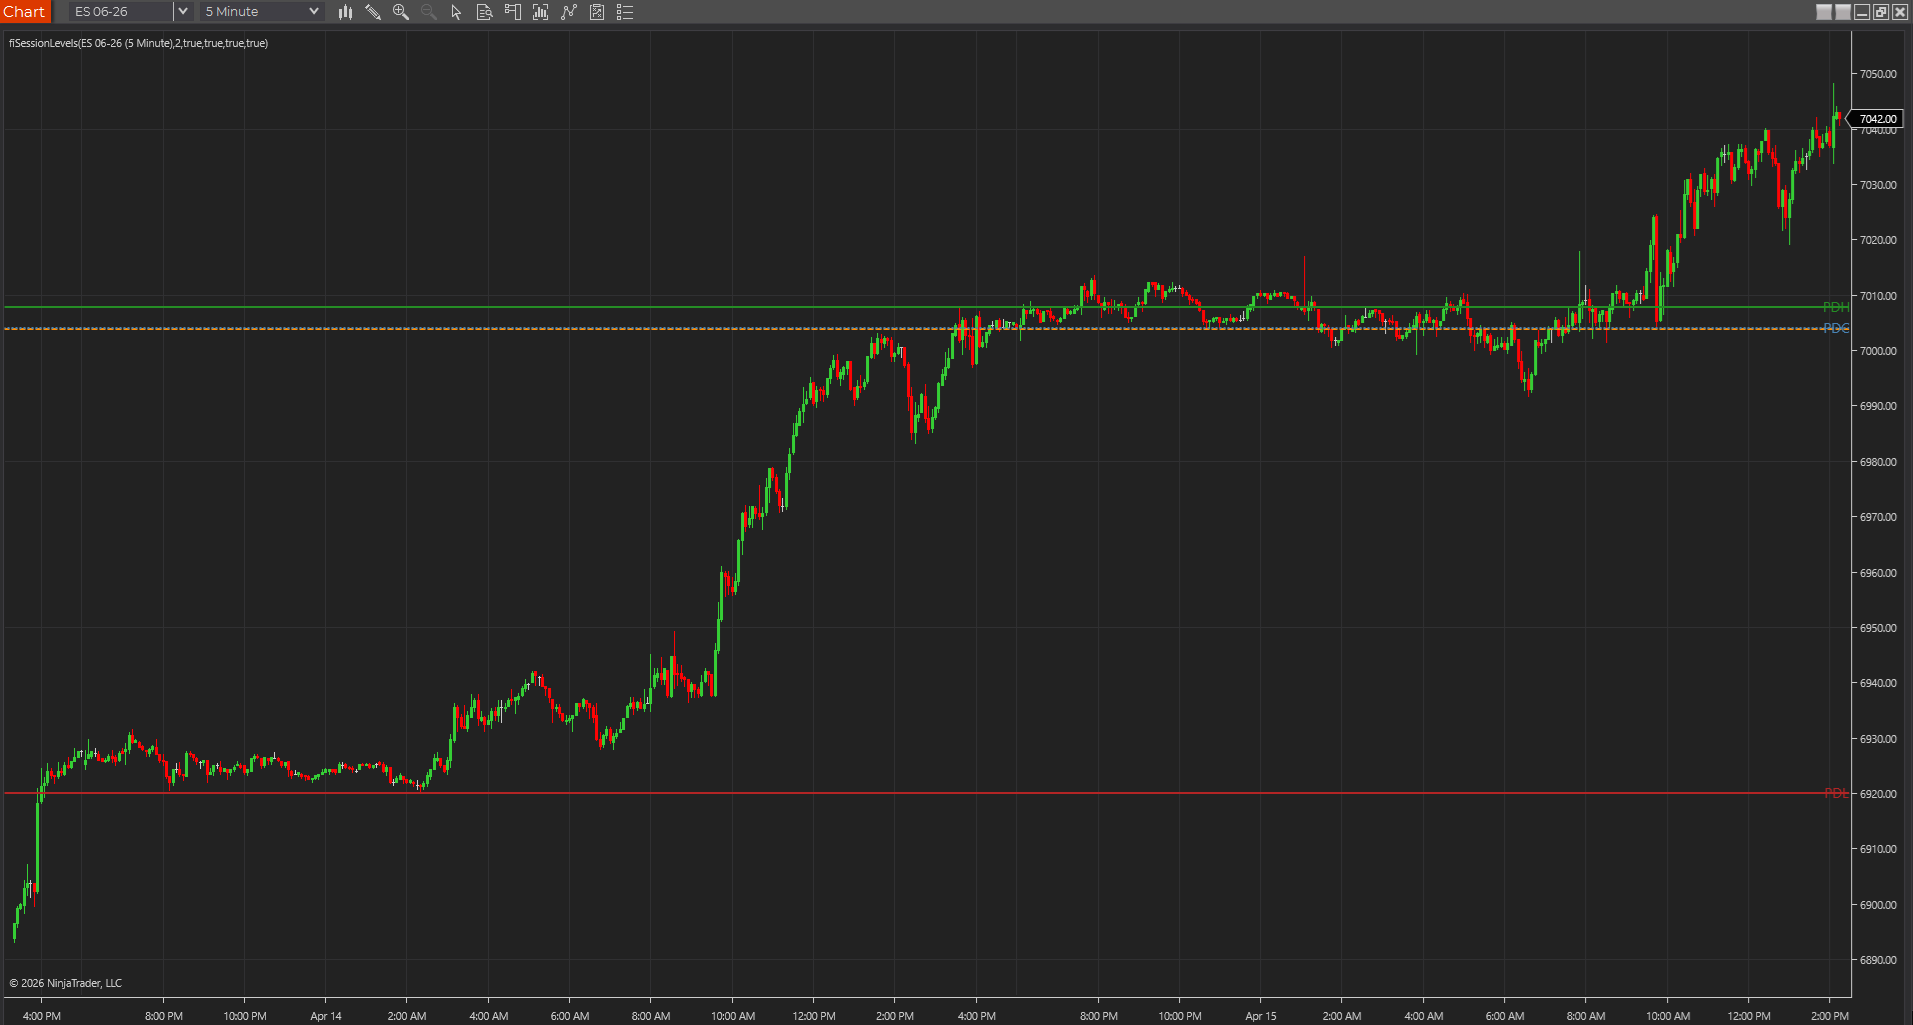
Manually spot-check a few bars or levels
The cleanest TradeStation testing habit is to compare a few visible outputs by hand. If a prior-session high is plotted, confirm it. If an opening-range boundary is drawn, confirm it. If a trend-strength number moves, confirm that it reacts when the chart tells you it should.
- A few manual checks beat a broad visual impression.
- This is how you catch small but important behavior drift early.
- The study should survive explanation, not just screenshots.
A clean chart should make the indicator easier to judge, not harder
If the study still feels confusing when it is the only thing on the chart, the problem usually is not a lack of supporting tools. It is usually one of three issues: the defaults are poor, the session assumptions are off, or the indicator logic is not as clear as it looked in the editor. Clean-chart testing helps you see that without workspace camouflage.
- Good TradeStation studies usually become clearer on a plain chart.
- Confusion on a clean chart is often a useful warning sign.
- You want the chart to simplify the verdict, not hide it.
Best next reads
These pages pick up the questions most readers usually have next, so you do not have to back out and start a fresh search.
Frequently asked questions
What is the first chart-side check after Verify passes in TradeStation?
Load the study on a clean chart, inspect Format Analysis Techniques, and confirm the session and any extra data streams match what the code expects.
Why test on a clean chart instead of a saved workspace?
Because a clean chart exposes whether the indicator itself is behaving correctly, while a templated workspace can hide pane, session, and input problems behind unrelated settings.
What is a bad sign when testing a TradeStation indicator on a clean chart?
If the study gets harder to understand once the workspace clutter is removed, that usually means the inputs, pane placement, or core logic still need work. A strong indicator should become easier to judge on a plain chart.