Guide walkthrough
Start reading here
This is the main article body, where the page shifts from summary cards into the actual workflow and decision-making notes.
On this page
Key terms for this guide
These glossary pages cover the ideas and platform language most likely to matter as you work through this guide.
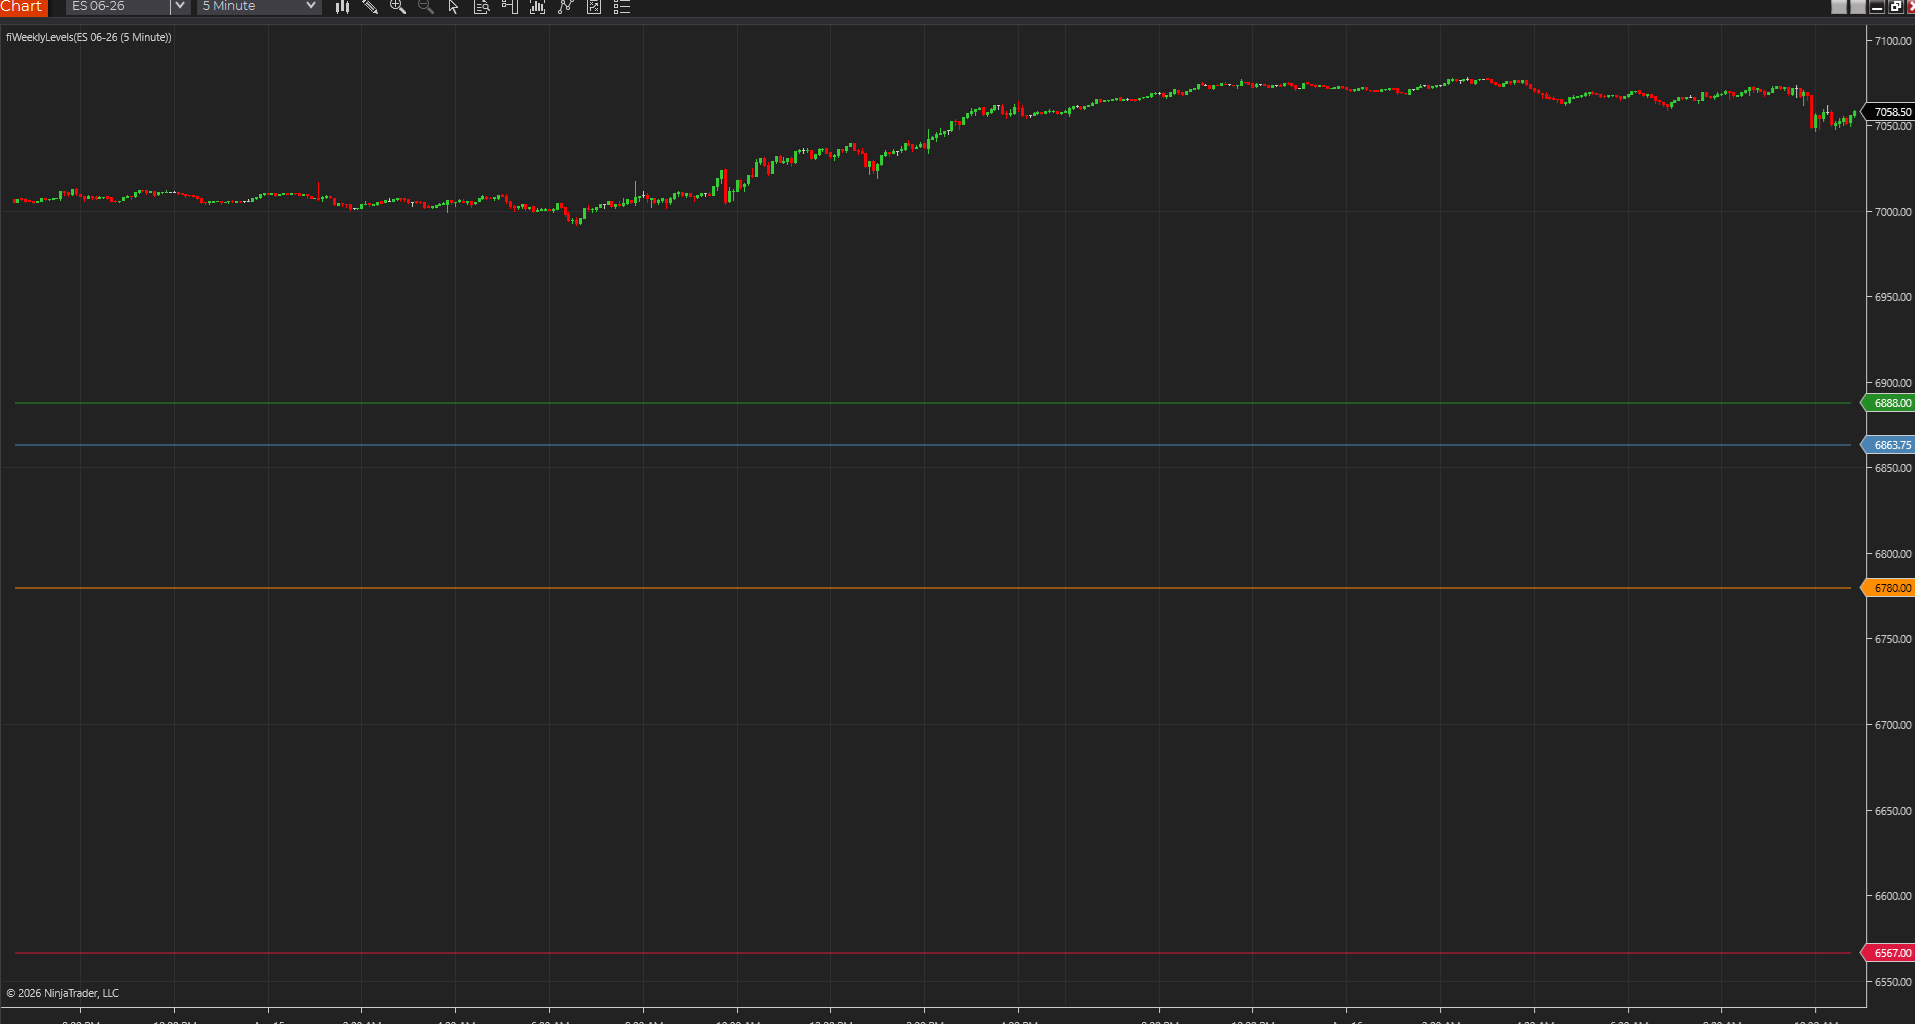
Weekly levels usually carry the day-to-day map
For many active traders, weekly levels deserve the first layer because they refresh often enough to stay relevant while still giving higher-time-frame structure.
- Weekly levels often strike the best balance between relevance and broader perspective.
- They are easier to use day to day than a full stack of broader anchors.
- That is why they usually deserve priority when chart space is limited.
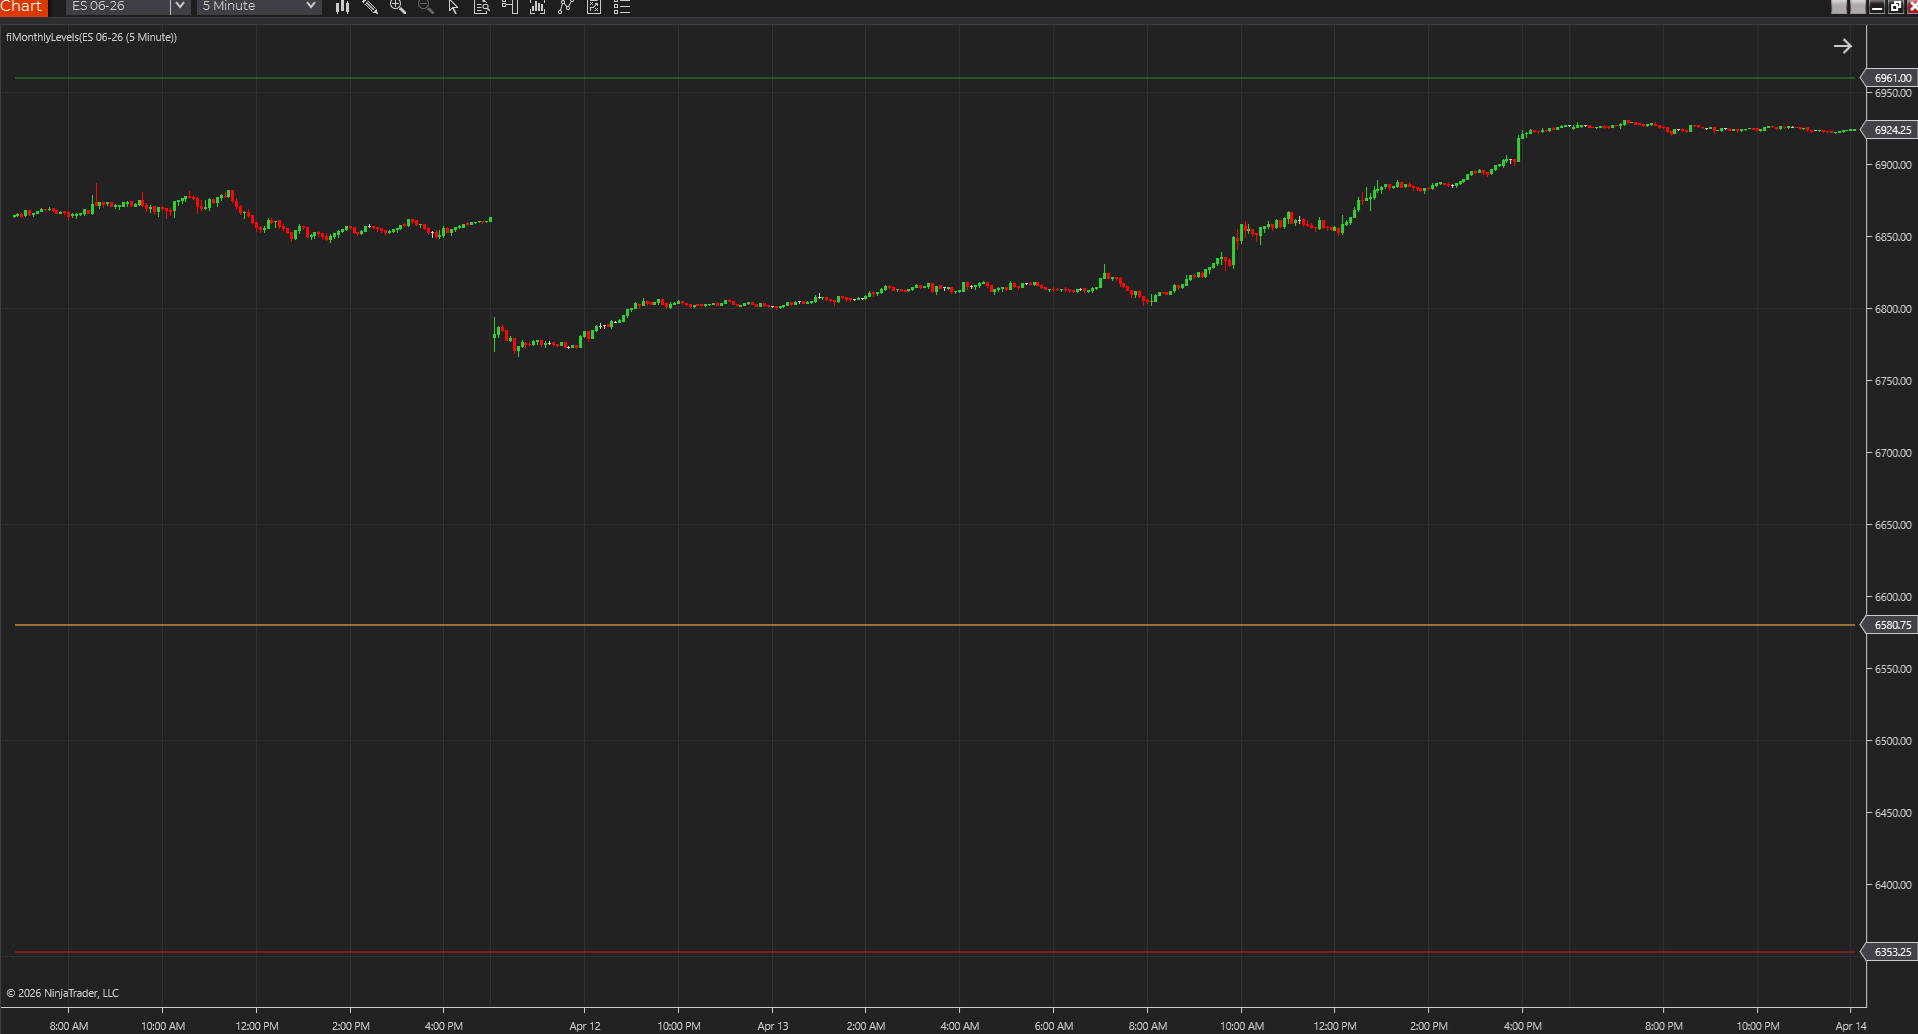
Monthly levels are broader anchor points
Monthly levels are more useful as broad checkpoints than as dense execution lines. They are strongest when they tell you the market is pressing into bigger structure.
- Monthly references often matter more as context than as immediate entry triggers.
- They are valuable when the market is approaching a larger decision zone.
- That makes them ideal as anchors rather than as a dense second ladder.
Do not let monthly levels crowd out the weekly map
A common mistake is treating weekly and monthly levels like equal layers that all deserve the same visual weight. In most workflows the weekly map should stay more visible, while monthly levels only step forward when they actually change the read.
- Not every monthly line belongs on the chart at once.
- If the monthly layer makes the weekly map harder to see, the stack is backwards.
- The cleaner hierarchy is usually weekly first, monthly second.
Look for overlap instead of loading every line
The cleanest way to combine weekly and monthly levels is to notice where they overlap or sit near the same decision area. That gives you stronger context without flooding the chart.
- Overlap helps rank which higher-time-frame areas deserve attention.
- Clusters matter more than isolated lines that never affect the session.
- That is how higher-time-frame context becomes usable instead of decorative.
Best next reads
These pages pick up the questions most readers usually have next, so you do not have to back out and start a fresh search.
Frequently asked questions
Which should come first, weekly or monthly levels?
Usually weekly levels. They tend to stay more relevant for active trading while still giving broader structure.
What are monthly levels best used for?
Monthly levels are best used as broad anchors or checkpoints that explain when the market is pressing into bigger structure.
How do I know if I have too many higher-time-frame lines on the chart?
If the weekly map gets harder to read or every line seems equally important, the stack is too heavy and should be simplified.