What this version is for
This MultiCharts PowerLanguage page is for traders who want the logic in source form rather than a packaged NinjaTrader import. It is best used as a transparent starting point that can be reviewed, compiled, and adjusted inside your own workspace.
That makes this page useful for more than copying code. It also helps you compare how the same trading idea is expressed across platforms, which parts of the workflow are universal, and which parts are specific to MultiCharts PowerLanguage. If you are moving between platforms or validating whether a concept ports cleanly, source pages like this are often more educational than packaged files alone.
Where it fits
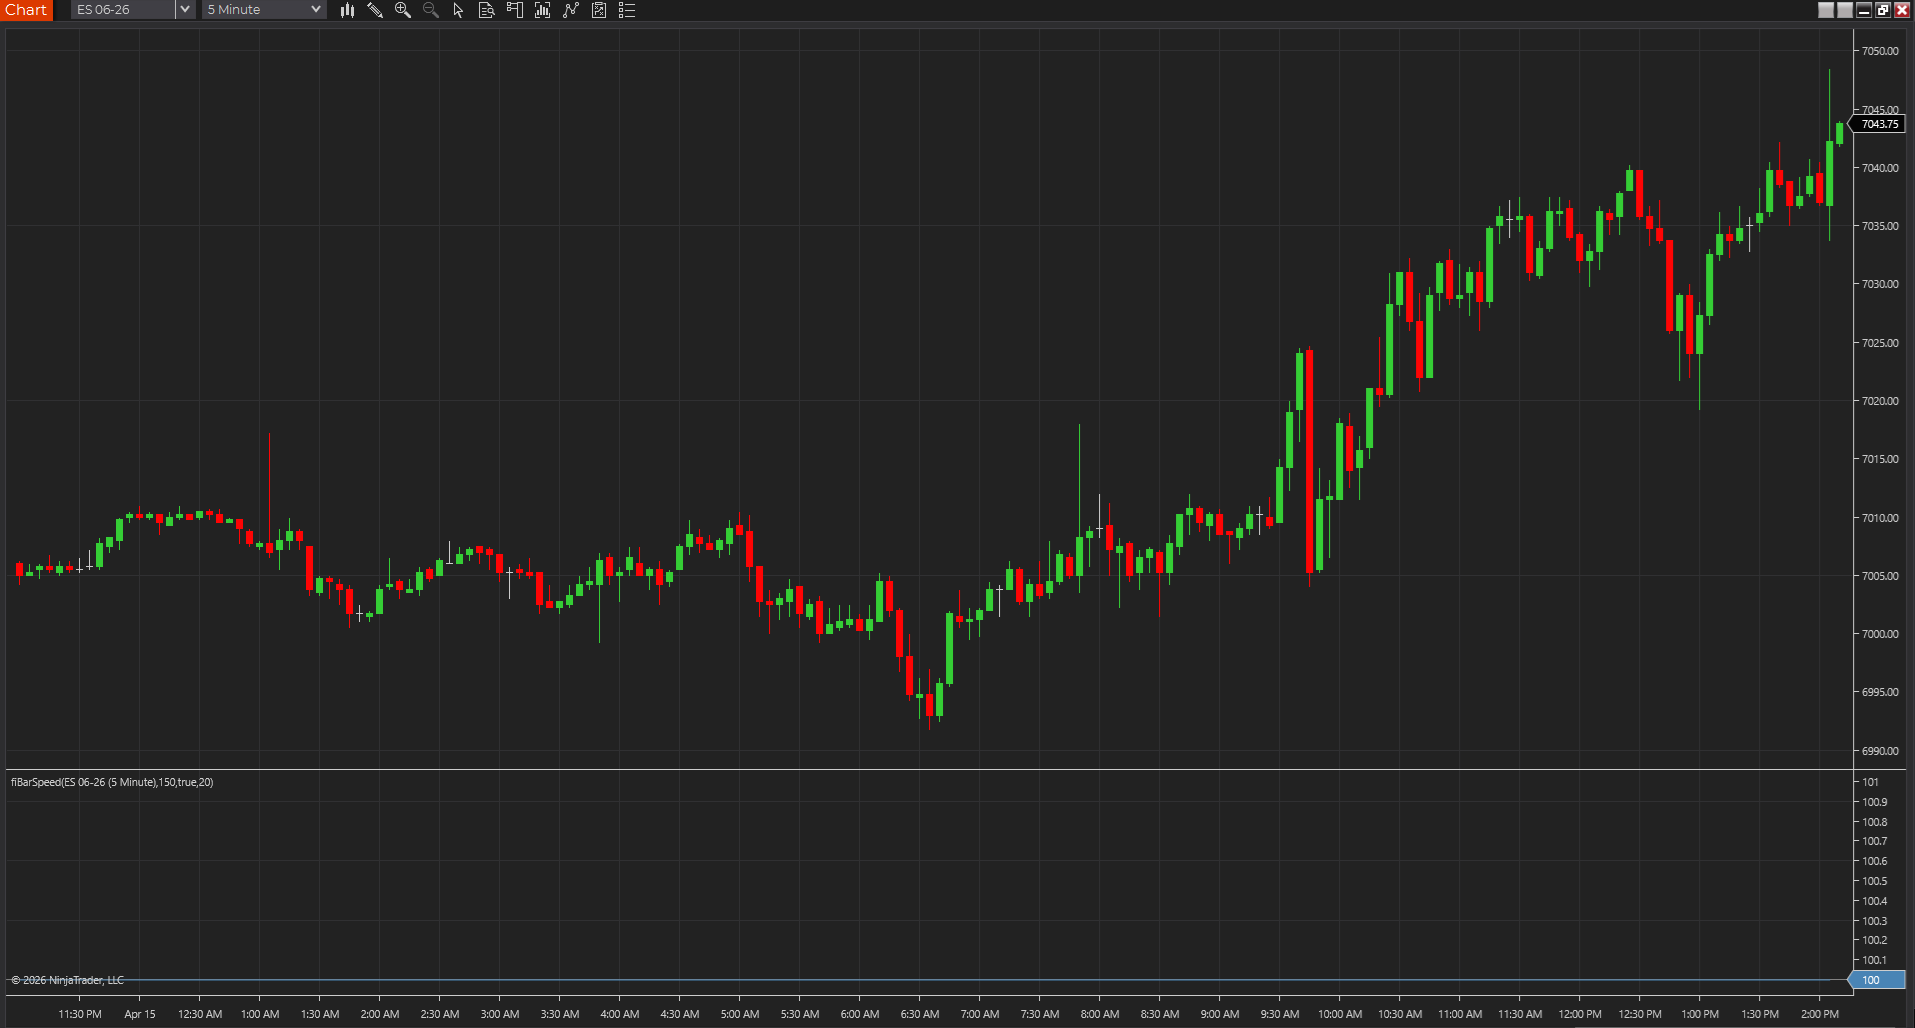
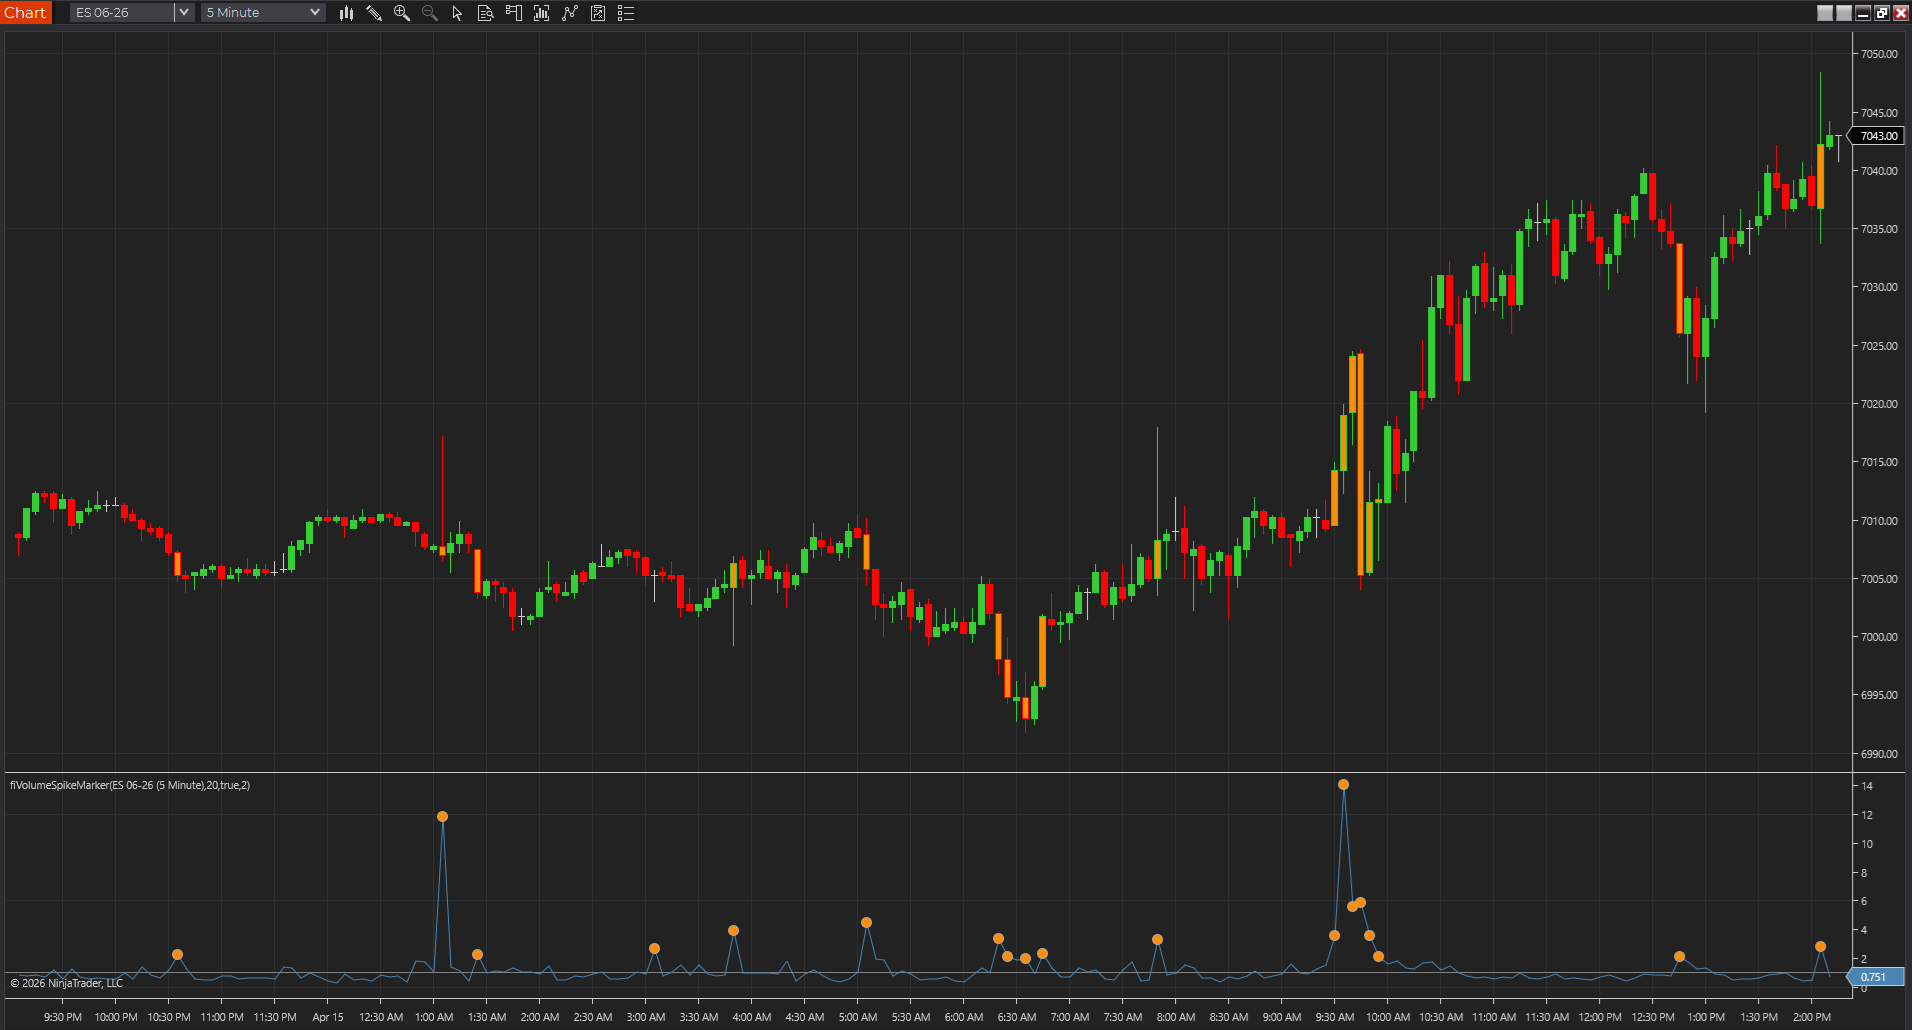
Volume Spike Marker helps traders see when participation jumps above its recent baseline. It is most useful when you want to separate real activity expansion from routine bar-to-bar noise during breakouts, reversals, or squeezes.
In the broader library, this source page sits somewhere between a product page and a guide. The main indicator page explains the tool at a higher level, while this page focuses on implementation and adaptation. Traders who already know they want volume spike marker logic on MultiCharts PowerLanguage usually get the most value here because they can move from concept to code without leaving the site.
What to verify first
- Confirm the default inputs make sense for your market and timeframe.
- Compile the script before changing anything else.
- Compare the plotted behavior on a simple chart before adding alerts or automation.
- Treat the script as chart context, not as a promise of trading performance.
What usually needs adaptation on MultiCharts PowerLanguage
MultiCharts source pages need extra care because PowerLanguage often looks close enough to EasyLanguage that traders assume the port is done once it compiles. In practice, session templates, secondary data streams, recalculation behavior, and chart-level settings are where the drift usually shows up. This page is strongest when you use it to inspect those assumptions, not just paste the code and move on.
MultiCharts PowerLanguage verification checklist
- Compile in PowerLanguage Editor, then confirm the study is attached to the chart type and session template you actually trade.
- Check whether the script assumes Data2, a specific session definition, or bar-status behavior that can drift between workspaces.
- Recalculate once and compare the plotted behavior on a clean chart before adding alerts or automation.
- Check whether the script is using exchange volume, tick volume, or a proxy that changes the interpretation.
- Watch the last few developing bars carefully so you know whether the read is confirmed or still stretching into noise.
- Validate the output on the chart type you actually trade, because bar construction can change the whole story.
That verification step matters because code that compiles is not automatically code that behaves the way you expect. Chart type, bar indexing, session settings, alert behavior, and plotting defaults can all change the reading of an otherwise simple study. Taking a few minutes to validate behavior on a clean chart is almost always cheaper than debugging assumptions after the script is already part of a larger workspace.
Source code
{
  Volume Spike Marker
  FreeIndicators.com source example.
  Works as a starting point for TradeStation EasyLanguage and MultiCharts PowerLanguage.
}

Inputs: Lookback(20), SpikeMultiple(2);
Vars: AvgVolume(0), Ratio(0);

AvgVolume = Average(Volume, Lookback);
If AvgVolume > 0 Then Ratio = Volume / AvgVolume Else Ratio = 0;

Plot1(Ratio, "VolRatio");
If Ratio >= SpikeMultiple Then Plot2(Ratio, "Spike");
Settings and tradeoffs
Controls the bars used for average volume.
Sets how far above average volume a bar must be to mark.
Optionally colors price bars when a spike appears.
Settings are where a script usually shifts from generic example to something personal and useful. A default input that behaves well on one market may feel too slow, too fast, too wide, or too noisy somewhere else. That does not mean the study is wrong. It usually means the script still needs to be matched to the instrument, the chart type, and the decision style you actually care about.
Limitations
- A volume spike does not determine direction by itself.
- Volume data quality varies by market and feed.
- News bars can produce extreme readings.
Those limitations are not just caveats for the sake of caution. They are often the exact reasons a study feels helpful on one chart and disappointing on another. A clean source page should tell you where the logic is likely to travel well, where it needs adaptation, and where it should be treated as context rather than as an automated answer. That is especially important when the same concept is being translated from one trading platform to another.
Before you automate anything
Even when a script looks straightforward, it is worth slowing down before attaching alerts, automation, or trade execution logic to it. Indicator code often carries assumptions about confirmed bars, current-bar updates, session handling, or how signals should be interpreted in context. The safest progression is to review the code, compile it, observe it on a chart, compare it to the main product page, and only then decide whether it deserves a larger role in your workflow.
Think of this page as a working reference rather than a promise. It gives you a transparent starting point for MultiCharts PowerLanguage, a live chart capture tied to the same idea, and a route back to the broader product and guide system if you want more context before making changes.